
Fig. 4
- ID
- ZDB-FIG-180918-14
- Publication
- Rosowski et al., 2018 - Macrophages inhibit Aspergillus fumigatus germination and neutrophil-mediated fungal killing
- Other Figures
- All Figure Page
- Back to All Figure Page
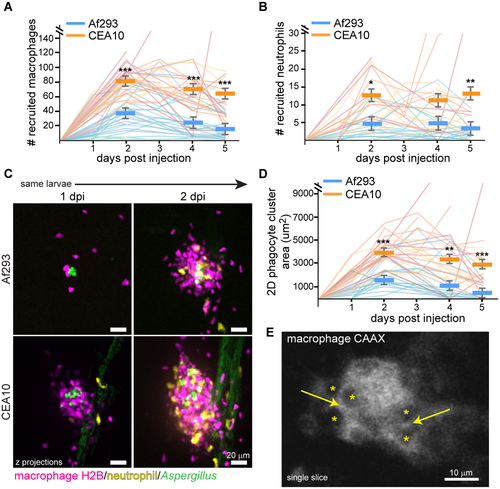
Macrophages form tight clusters around A. fumigatus. A-D. Dual macrophage-nuclear (mpeg1:mcherry-H2B) and neutrophil (lyz:BFP) labeled larvae were infected with YFP- or GFP-expressing A. fumigatus TBK1.1 (Af293) or TFYL49.1 (CEA10) strains and imaged days 1–5 post injection. Macrophage (A) and neutrophil (B) recruitment as well as phagocyte cluster size (D) were quantified. Representative images (C, scale bar represents 20 μm) and pooled quantification from 3 experiments (A, B, D) are shown. Each line in graphs represents one larvae followed for the entire course of infection, lines are color-coded by replicate, bars represent pooled lsmeans ± SEM, P values calculated by ANOVA. Af293 n = 25, CEA10 n = 27 for macrophage and cluster area quantification; Af293 n = 17, CEA10 n = 18 for neutrophil quantification. E. Macrophage-membrane (mfap4:tomato-CAAX) labeled larvae were infected with CEA17 KU80Δ (CEA10) and imaged 3 dpi. Asterisks represent cell nuclei, arrows indicate cell-cell junctions. Scale bar represents 10 μm. See also S4 Fig. |
| Genes: | |
|---|---|
| Fish: | |
| Condition: | |
| Anatomical Term: | |
| Stage Range: | Long-pec to Day 6 |
| Fish: | |
|---|---|
| Condition: | |
| Observed In: | |
| Stage Range: | Long-pec to Day 6 |