
- Title
-
Pseudopodium-enriched atypical kinase 1 mediates angiogenesis by modulating GATA2-dependent VEGFR2 transcription
- Authors
- Wang, H., Lapek, J., Fujimura, K., Strnadel, J., Liu, B., Gonzalez, D.J., Zhang, W., Watson, F., Yu, V., Liu, C., Melo, C.M., Miller, Y.I., Elliott, K.C., Cheresh, D.A., Klemke, R.L.
- Source
- Full text @ Cell Discov
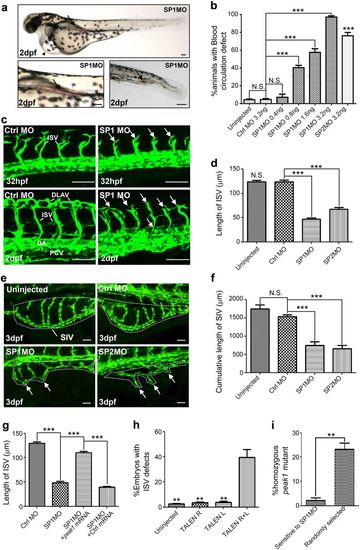
peak1 is required for vascular development in zebrafish embryos. a Bright-field images of pericardial edema (upper panel, arrowhead) and blood accumulation in the anterior aorta as well as in the tail region (arrows) of peak1 morpholino (MO) knockdown embryos (SP1MO). Pictures were taken at 2 days-post-fertilization (2dpf). Also see Supplementary Fig.S2c. b Bar graph shows the percentage of animals with vascular defects caused by control (Ctrl MO) or two different peak1 specific morpholinos SP1MO and SP2MO. Mean ± SEM; n = 30. c Confocal images at indicated time points of vasculature formation of Tg(fli1:egfp)y1 zebrafish embryos treated as in (a). ISVs = intersegmental vessels. DLAVs = dorsal longitudinal anastomotic vessels. DA = dorsal aorta. PCV = posterior cardinal vein. hpf = hours-post-fertilization. Arrows point to disorganized endothelial sprouts and vessel structures. d Bar graph depicts the average ISV length at 32 hpf of MO-treated embryos. Mean ± SEM; n = 50. e Confocal images of subintestinal vessels (SIVs, dashed line circled region) were captured at 3dpf from embryos treated as in (c). Arrows show SIV defects. f Bar graph shows the cumulative length of SIVs per embryo from embryos treated as in (e); Mean ± SEM; n = 10. g Bar graph represents the average ISV length at 32hpf of embryos treated as in (c) and co-treated with peak1 mRNA or a nonspecific control mRNA (Ctrl mRNA). Mean ± SEM; n = 50. h Bar graph shows the percentage of Tg(fli1:egfp)y1embryos with mosaic disrupted ISV defects after treatment of peak1 specific transcription activator-like effector nuclease (TALEN) mRNAs. TALEN R = right arm (120 pg); TALEN L = left arm (120 pg); TALEN R + L = both arms (60 pg each); Mean ± SEM; n = 90. i Embryos from incrossed heterozygous peak1 ∆2/ + zebrafish were injected with SP1MO at one-cell stage, subsequently selected at 72 hpf for the vascular defects (Sensitive to SP1MO) or randomly selected and all genotyped individually. Bar graph represents percentage of homozygous peak1∆2/ ∆2 in each group. Mean ± SEM; n = 90. All the data are representative of at least three independent experiments. ***, P < 0.001; **, P < 0.01; N.S., not significant; in (b, d), vs. Ctrl MO; in (h), vs. TALEN R + L. Scale bar = 50 μm PHENOTYPE:
|
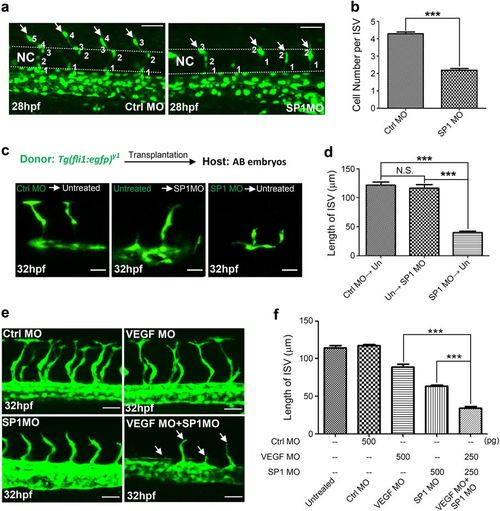
peak1 is required for endothelial cell (EC) proliferation and migration in zebrafish early development. a Confocal images of labeled ISV ECs at 28hpf of Tg(fli:nls-egfp) embryos treated with MOs. Also see Video S1 and S2. Arrows point to tip cells sprouting from DA. Dashed line = notochord (NC). b Bar graph represents the average number of ECs per ISV. Mean ± SEM; n = 30. c Endothelial precursor cells were isolated from sphere stage Tg(fli1:egfp)y1 embryos (donor) and transplanted into same stage wild type AB host embryos (host). Either donor or host embryos were treated with indicated MOs at one-cell stage. ISV formation from engrafted GFP ECs were imaged using confocal microscopy at 32hpf. d Bar graph shows the average length of GFP labeled ISVs from embryos treated as in (c). Mean ± SEM; n = 10. All data are representative of at least three independent experiments. e Confocal images of ISVs of Tg(fli1:egfp)y1 embryos treated with sup-optimal amount of Ctrl MO, SP1MO, VEGF MO or indicated combination. Arrows show stunted ISVs. f Bar graph shows the average length of ISVs from embryos treated as in (e). Mean ± SEM; n = 30. ***, P < 0.001; N.S., not significant. Scale bar = 30 μm |
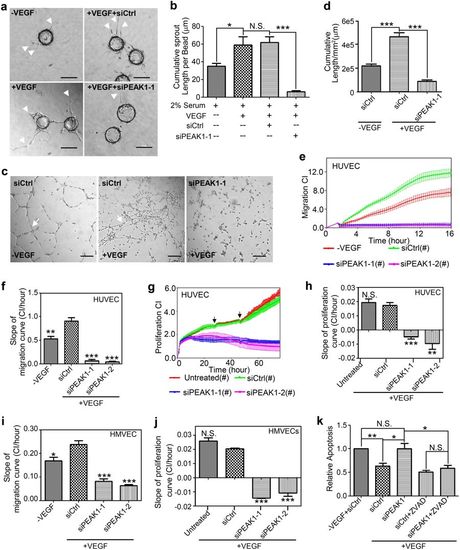
PEAK1 is required for Vascular Endothelial Growth Factor A (VEGFA)-induced proliferation, migration and morphogenesis of human ECs in vitro. a Phase-contrast images of fibrin gel sprouting assay with Human Umbilical Vein Endothelial Cells (HUVECs) transfected with control (siCtrl) or PEAK1 (siPEAK1-1) siRNA and treated with (+VEGF) or without VEGF (-VEGF). Arrowheads show vessel sprouts radiating from the bead surface. b Bar graph represents the cumulative length of sprouts per bead. Mean ± SEM; n = 10. c Phase-contrast images of Matrigel tube-forming assay with HUVECs treated with siRNAs in the presence or absence of VEGF. Arrows show vascular tubes. (d) Bar graph represents cumulative length of vascular tubes (per mm2) formed as in (c). Mean ± SEM; n = 5. Real-time cell migration (e, f, i) or proliferation (g, h, j) kinetics were measured by xCELLigence electrical impedance system of HUVECs (e–h) or Human Cardiac Microvascular Endothelial Cells (HMVECs, i, j) treated with indicated siRNAs. The chambers were coated with collagen I. Bar graph represents the slopes of the migration curves (f, i, from 2 to 12 h) or proliferation curves (h, j, from 4 to 72 h) of HUVECs and HMVECs. CI = Cell Index; Mean ± SEM of quadruplicate wells. (k) HUVECs were transfected with indicated siRNA, treated with or without VEGF and co-treated with or without zVAD, a pan-caspase inhibitor. Apoptosis was then measured by FACS with staining of 7-AAD and FITC-Annexin-V. Bar graph represents relative apoptotic cell ratio normalized with (–VEGF + siCtrl) group. Mean ± SEM; n = 3. All data are representative of at least three independent experiments. ***P < 0.001; **P < 0.01; *P < 0.05; N.S., not significant; (f, h, i, j), vs. siCtrl + VEGF group. Scale bar = 10 μm |
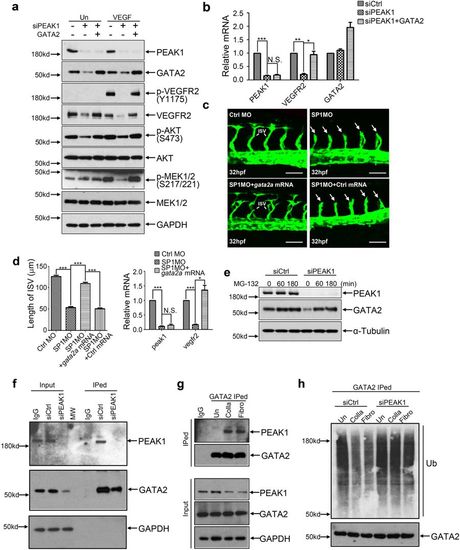
PEAK1 regulates VEGFR2 transcription through GATA2. a WB of HUVECs treated with siRNAs, transfected or not transfected with a plasmid encoding GATA2, and stimulated with or without VEGF for 10 mins. Cells were cultured on collagen I coated plates. b Bar graph represents relative mRNA levels vs. HPRT1 by qPCR analysis of HUVECs treated as in (a). c Confocal images of ISVs at 32 hpf of Tg(fli1:egfp)y1embryos with co-injection of gata2a mRNA or control mRNA and indicated MOs. Arrows point to stunted and disorganized endothelial sprouts. Scale bar = 50 μm. d Left bar graph represents the average ISV length of embryos treated as in (c). Mean ± SEM; n = 50. Right bar graph represents relative mRNA levels vs. zebrafish actb1 from the embryos treated as in (c) by qPCR analysis. Mean ± SEM; n = 3. HUVECs were cultured on collagen I-coated plates in (e) and (f). e WB of HUVECs transfected with siRNAs and treated with proteasome inhibitor MG-132. f, g Co-immunoprecipitated (IP) proteins from HUVECs with anti-GATA2 agarose were analyzed by WB for indicated proteins. In g, HUVECs were attached to plastic dishes with indicated coating. To compensate the protein level of GATA2 in Un group, the input was 1.8 folds compared to Fibro and Colla. h HUVECs were attached to plastic dishes with indicated coating and treated with different siRNAs. ECs were then treated with MG-132 for 6 h. Ubiquitination of IPed GATA2 protein was analyzed by WB. All data are representative of at least three independent experiments. ***P < 0.001; **P < 0.01; *P < 0.05; N.S. not significant PHENOTYPE:
|
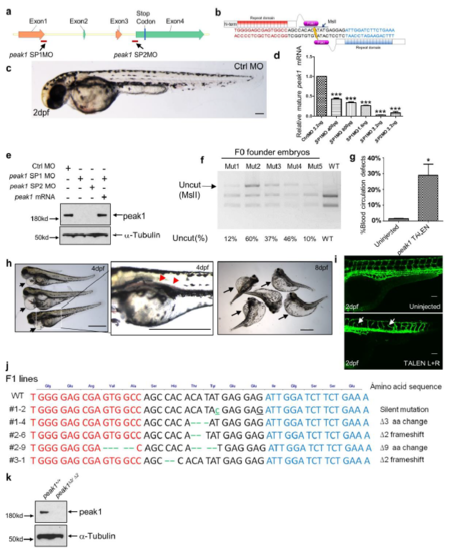
peak1 is required for vascular development in zebrafish embryos. (a) Schematic showing design of splicing morpholino to target the zebrafish peak1 gene. (b) Schematic showing the design of TALEN used to target the zebrafish peak1 gene. (c) Bright field image show normal pericardial cavity and circulation of Ctrl MO injected zebrafish embryos. Scale bar = 50 μm. (d) Bar graph represents relative peak1 mRNA level versus actn1 from 30 hpf embryos treated with Ctrl MO, SP1MO or SP2MO and analyzed by qPCR. (e) Western blot analyses for indicated proteins of 30 hpf embryos treated as in Figure 1c. (f) Genotyping of zebrafish peak1 TALEN F0 founder embryos. Primers TALEN test F+R and restriction enzyme MslI were used. Uncut (%), the percentage of uncut band out of the total DNA. (g) Bar graph represents percentage of animals with blood circulation defects caused by injection of zebrafish peak1 TALEN mRNAs. (h) Bright field images of zebrafish embryos showing severe pericardial edema (arrows) and blood circulation defects (arrowheads) caused by peak1 TALEN mRNAs at indicated dpf. Scale bar = 1 mm. (i) Confocal fluorescence images of the tail vasculature of Tg(fli1:egfp)y1 embryos treated with peak1 TALEN mRNAs were captured at 2dpf. Arrows point to mosaic stunted and disrupted ISV vessels. Scale bar = 50 μm. (j) DNA sequencing results of F1 TALEN mutant lines. (k) peak1Δ2/ Δ2 TALEN homozygous mutants were incrossed and progeny embryos were lysed at 2dpf and analyzed by western blotting with indicated antibodies. All data are representative of at least three independent experiments. ***, P<0.001; *, P<0.05; N.S., not significant. |

Unillustrated author statements PHENOTYPE:
|