
Fig. 3
- ID
- ZDB-FIG-180809-22
- Publication
- Wang et al., 2018 - Pseudopodium-enriched atypical kinase 1 mediates angiogenesis by modulating GATA2-dependent VEGFR2 transcription
- Other Figures
- All Figure Page
- Back to All Figure Page
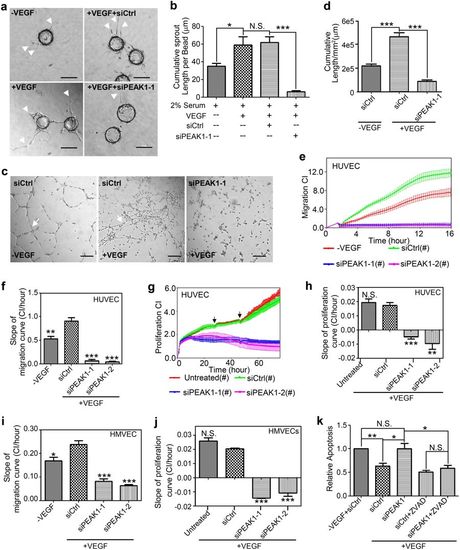
PEAK1 is required for Vascular Endothelial Growth Factor A (VEGFA)-induced proliferation, migration and morphogenesis of human ECs in vitro. a Phase-contrast images of fibrin gel sprouting assay with Human Umbilical Vein Endothelial Cells (HUVECs) transfected with control (siCtrl) or PEAK1 (siPEAK1-1) siRNA and treated with (+VEGF) or without VEGF (-VEGF). Arrowheads show vessel sprouts radiating from the bead surface. b Bar graph represents the cumulative length of sprouts per bead. Mean ± SEM; n = 10. c Phase-contrast images of Matrigel tube-forming assay with HUVECs treated with siRNAs in the presence or absence of VEGF. Arrows show vascular tubes. (d) Bar graph represents cumulative length of vascular tubes (per mm2) formed as in (c). Mean ± SEM; n = 5. Real-time cell migration (e, f, i) or proliferation (g, h, j) kinetics were measured by xCELLigence electrical impedance system of HUVECs (e–h) or Human Cardiac Microvascular Endothelial Cells (HMVECs, i, j) treated with indicated siRNAs. The chambers were coated with collagen I. Bar graph represents the slopes of the migration curves (f, i, from 2 to 12 h) or proliferation curves (h, j, from 4 to 72 h) of HUVECs and HMVECs. CI = Cell Index; Mean ± SEM of quadruplicate wells. (k) HUVECs were transfected with indicated siRNA, treated with or without VEGF and co-treated with or without zVAD, a pan-caspase inhibitor. Apoptosis was then measured by FACS with staining of 7-AAD and FITC-Annexin-V. Bar graph represents relative apoptotic cell ratio normalized with (–VEGF + siCtrl) group. Mean ± SEM; n = 3. All data are representative of at least three independent experiments. ***P < 0.001; **P < 0.01; *P < 0.05; N.S., not significant; (f, h, i, j), vs. siCtrl + VEGF group. Scale bar = 10 μm |