
|
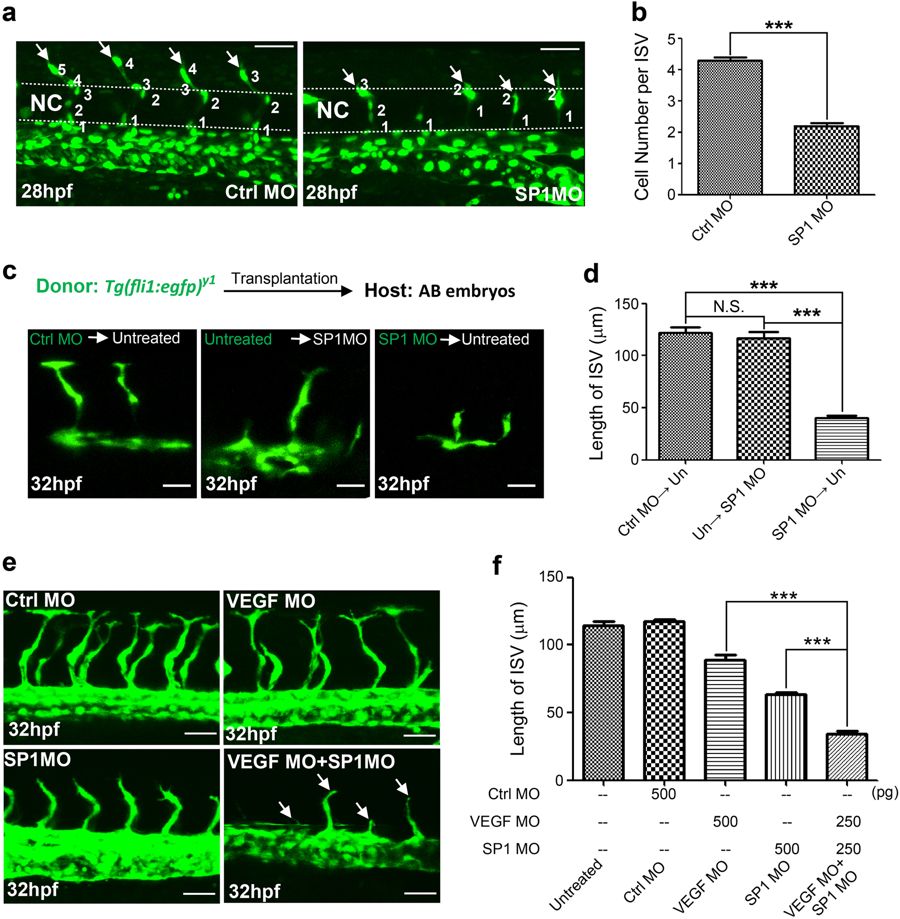
Fig. 2
peak1 is required for endothelial cell (EC) proliferation and migration in zebrafish early development.
a Confocal images of labeled ISV ECs at 28hpf of Tg(fli:nls-egfp) embryos treated with MOs. Also see Video S1 and S2. Arrows point to tip cells sprouting from DA. Dashed line = notochord (NC). b Bar graph represents the average number of ECs per ISV. Mean ± SEM; n = 30. c Endothelial precursor cells were isolated from sphere stage Tg(fli1:egfp)y1 embryos (donor) and transplanted into same stage wild type AB host embryos (host). Either donor or host embryos were treated with indicated MOs at one-cell stage. ISV formation from engrafted GFP ECs were imaged using confocal microscopy at 32hpf. d Bar graph shows the average length of GFP labeled ISVs from embryos treated as in (c). Mean ± SEM; n = 10. All data are representative of at least three independent experiments. e Confocal images of ISVs of Tg(fli1:egfp)y1 embryos treated with sup-optimal amount of Ctrl MO, SP1MO, VEGF MO or indicated combination. Arrows show stunted ISVs. f Bar graph shows the average length of ISVs from embryos treated as in (e). Mean ± SEM; n = 30. ***, P < 0.001; N.S., not significant. Scale bar = 30 μm