
- Title
-
Interaction of hepatic stellate cells with neutrophils and macrophages in the liver following oncogenic kras activation in transgenic zebrafish
- Authors
- Yang, Q., Yan, C., Gong, Z.
- Source
- Full text @ Sci. Rep.
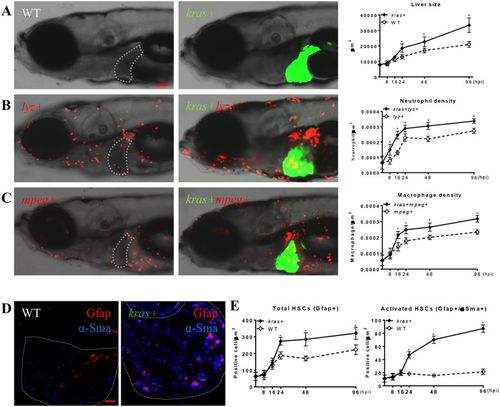
Rapid modification of tumor microenvironment following oncogenic krasV12 expression. Kras+ fish were crossed with lyz+ or mpeg+ fish. Larvae from the crosses were treated with 20 μg/ml dox from 3 dpf and fixed at 8, 16, 24, 48, 96 hpi. At each time point, 10 fish/group were mounted in methylcellulose and imaged at left lateral side under a confocal microscope. Neutrophils, macrophages and HSCs were counted manually based on DsRed/mCherry fluorescence and Gfap or α-Sma staining. (A) Representative images of the WT (left) or kras+ (middle) larvae at 96 hpi and quantification of 2D liver size (right) from 8 hpi to 96 hpi, (B) Representative images of lyz+ larvae in the WT (left) or kras+ (middle) background at 96 hpi and quantification of neutrophil density in the liver from 8 hpi to 96 hpi. (C) Representative images of mpeg+ larvae in the WT (left) or kras+ (middle) background at 96 hpi and quantification of macrophage density in the liver from 8 hpi to 96 hpi. (D) Representative images of IF co-staining of GFAP (red) and α-Sma (blue) in liver sections of zebrafish larvae at 96 hpi. (E) Quantification of total HSC number (Gfap+) and activated HSCs (Gfap+ and α-Sma+) in liver sections in larvae from 8 hpi to 96 hpi. Livers are outlined when GFP signal is not available. In all experiments, n = 20 for each group. *P < 0.05. Error bars represent biological replicates. Scale bars: 20 μm. |
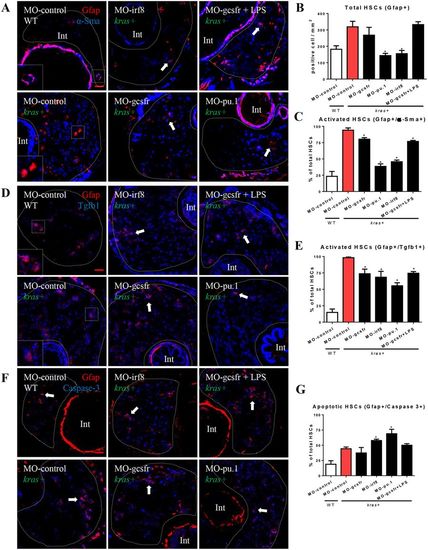
Effects of manipulation of neutrophils and macrophages on HSC density and activation. Wildtype and kras+ embryos at one-cell stage were injected with various morpholinos for manipulation of neutrophil and macrophage numbers, and treated with 20 μg/ml dox (or together with LPS) from 3 dpf to 6 dpf. Total HSC number and activated ratio were measured by IF co-staining of Gfap and α-Sma in liver sections. (A) IF co-staining of Gfap (red) and a-Sma (blue). (B) Quantification of total HSC number (Gfap+ cells). (C) Quantification of ratio of activated HSC by counting percentage of α-Sma+ cells in the Gfap+ cell population. (D) IF co-staining of Gfap (red) and Tgfb1 (blue). (E) Quantification of ratio of Tgfb1+ HSCs. (F) IF co-staining of Gfap (red) and Caspase-3 (blue). (G) Quantification of ratio of Caspase-3+ apoptotic HSCs. Livers are outlined by dash lines. Arrows indicate examples of co-staining and Int indicates intestine. Insets in (A) and (D) are enlarged view of representative staining signals in the liver. In all experiments, n = 20 for each group. *P < 0.05, compare to the group in red. Error bars represent biological replicates. Scale bars: 20 μm. |
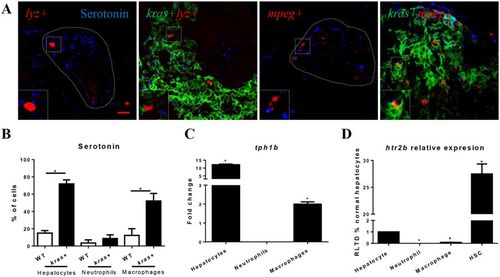
Determination of serotonin in hepatocytes, neutrophils and macrophages. (A) Representative images of IF staining of serotonin in liver sections of kras+/lyz+, lyz+ (control), kras+/mpeg+ and mpeg+ (control) larvae (6 dpf). Livers in wildtype larvae are outlined by dash lines. Scale bars: 20 μm. (B) Quantification of serotonin+ hepatocytes, neutrophils and macrophages. (C) Comparison of tph1b expression change after krasV12 induction in hepatocytes, neutrophils and macrophages. (D) Predominant expression of htr2b mRNA in HSCs. Htr2b mRNAs were measured and compared in hepatocytes, neutrophils, macrophages and HSCs with the level expression in hepatocytes was arbitrarily set as 1. Insets in (A) are enlarged view of representative staining signals in the liver. In all experiments, n = 20 for each group. *P < 0.05. Error bars represent biological replicates in (B) and technical replicates in (C) and (D). Scale bars: 20 μm. |
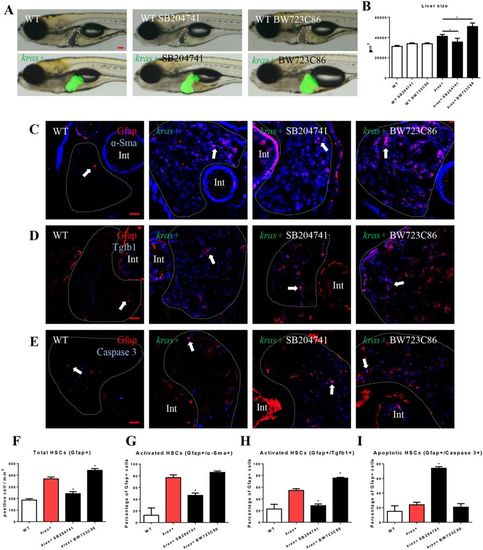
Effects of manipulation of Htr2b on tumorigenesis and HSCs. 3-dpf wildtype or kras+ larvae were co-treated with dox and SB204741 or BW723C86 for 4 days. More than 20 fish were analyzed in each group. (A) Gross morphology of larvae in left lateral view after 4 days induction. (B) Quantification of 2D liver size. (C,F,G) IF co-staining of Gfap and α-Sma on liver sections (C) quantification of total HSC density (F) and activated HSCs (G). (D,H) IF co-staining of Gfap and Tgfb1 on liver sections (C) and quantification of Tgfb1-expressing HSCs (H). (E,I) IF co-staining of Gfap and Caspase-3 on liver sections and quantification of apoptotic HSCs (I). Livers are marked by dash lines. Arrows indicate examples of co-staining and Int indicates intestine. In all experiments, n = 20 for each group. *P < 0.05, compare to the the group in red. Error bars represented biological replicates. Scale bar: 20 μm. |
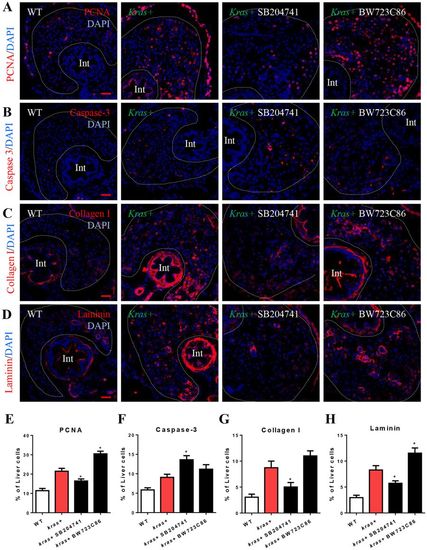
Effects of manipulation of Htr2b on hepatocarcinogenesis and liver fibrosis. 3-dpf wildtype or kras+ larvae were co-treated with dox and SB204741 or BW723C86 for 4 days. More than 20 fish were analyzed in each group. (A,E) IF staining of PCNA on liver sections (A) and quantification of PCNA positive cells (E). (B,F) IF staining of Caspase-3 on liver sections (B) and quantification of apoptotic cells (F). (C,G) IF staining of collagen I on liver sections (C) and quantification of percentage of collagen I positive area (G). (D,H) IF staining of Laminin on liver sections (D) and quantification of percentage of Laminin positive area (H). Livers are marked by dash lines. Arrows indicate examples of co-staining and Int indicates intestine. In all experiments, n = 20 for each group. *P < 0.05, compare to the the group in red. Error bars represented biological replicates. Scale bar: 20 μm. |
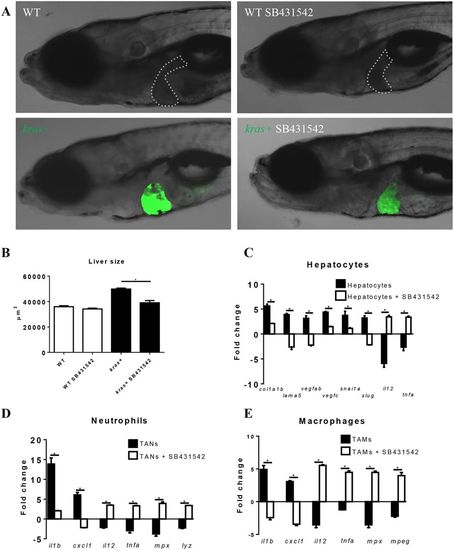
Effect of inhibition of Tgfb signaling on liver tumorigenesis and pro-tumor gene expression in hepatocytes, neutrophils and macrophages. 3-dpf wildtype or kras+ larvae were treated with dox and SB431542 for 4 days. (A,B) Gross morphology of larvae after 4 days treatments (A) and quantification of liver size (B). (C–E) Expression of selected genes for pro-fibrosis, EMT and anti-tumor in hepatocytes (C), neutrophils (D) and macrophages (E). Fold changes refer the expression levels in kras+ larvae versus wildtype larvae. In all experiments, n = 20 for each group. *P < 0.05. Error bars represent biological replicates in (B) and technical replicates in (C), (D) and (E). Scale bars: 20 μm. |
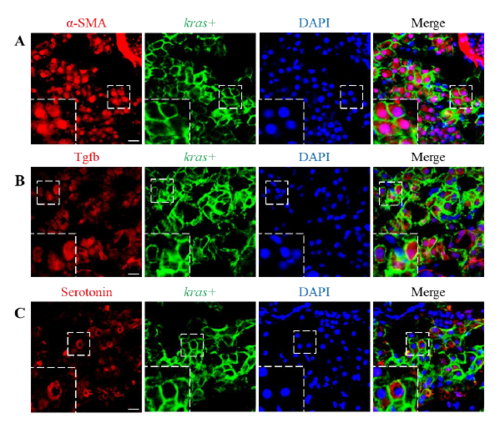
Cellular localization of α-SMA, Tgfb and Serotonin. 3-dpf kras+ larvae were treated with dox for 4 days and IF staining was carried out for α-SMA (A) Tgfb (B) and serotonin (C). Representative images of liver sections are shown. GFP signals were derived from GFP-Kras fusion protein in kras+ fish and are mainly in hepatocyte membrane and cortex region as we previously reported (reference 16). DAPI was count-stained for visualization of nuclei. Boxed regions are enlarged as insets in the left-bottom corners. Scale bar, 10 μm. |
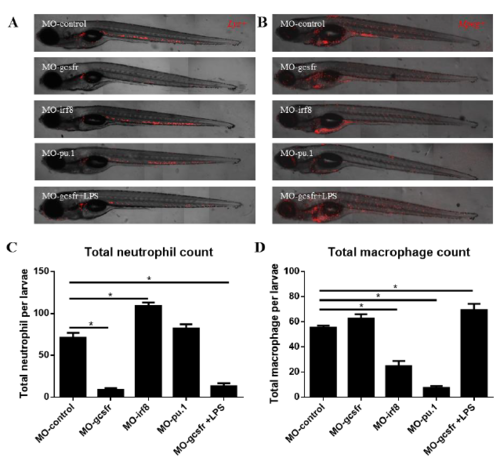
Effects of morpholinos on inhibition of differentiation of neutrophils or macrophages. lyz+ or mpeg+ fish were crossed with wildtype and morpholinos were injected into the yolk at one cell stage. (A) Representative images of lyz+ larvae after 6 days of morpholino injection. (B) Representative images of mpeg+ larvae after 6 days of morpholino injection. (C) Quantification of total neutrophil number in lyz+ larvae after 6 days of morpholino injection. (D) Quantification of total macrophage number in mpeg+ larvae after 6 days of morpholino injection. *P < 0.05. |
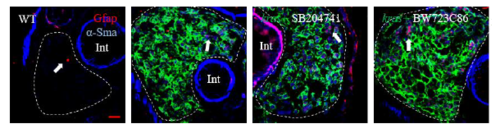
Merged image of GFAP, α-Sma and kras-EGFP to supplement Fig. 4C. |
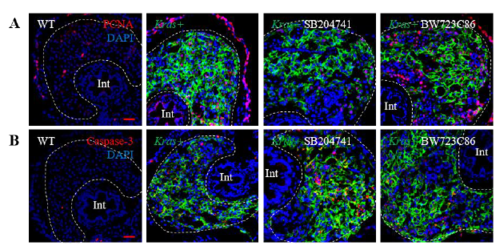
(A) Merged images of PCNA, DAPI and kras-EGFP to supplement Fig. 5A. (B) Merged images of Caspase 3, DAPI and kras-EGFP to supplement Fig. 5B. |