
FIGURE
Fig. S1
- ID
- ZDB-FIG-180808-21
- Publication
- Yang et al., 2018 - Interaction of hepatic stellate cells with neutrophils and macrophages in the liver following oncogenic kras activation in transgenic zebrafish
- Other Figures
- All Figure Page
- Back to All Figure Page
Fig. S1
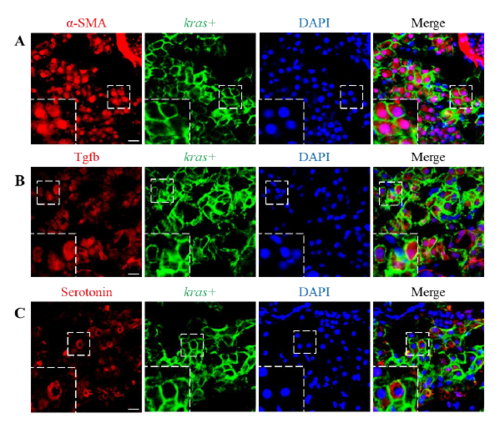
Cellular localization of α-SMA, Tgfb and Serotonin. 3-dpf kras+ larvae were treated with dox for 4 days and IF staining was carried out for α-SMA (A) Tgfb (B) and serotonin (C). Representative images of liver sections are shown. GFP signals were derived from GFP-Kras fusion protein in kras+ fish and are mainly in hepatocyte membrane and cortex region as we previously reported (reference 16). DAPI was count-stained for visualization of nuclei. Boxed regions are enlarged as insets in the left-bottom corners. Scale bar, 10 μm. |
Expression Data
Expression Detail
Antibody Labeling
Phenotype Data
Phenotype Detail
Acknowledgments
This image is the copyrighted work of the attributed author or publisher, and
ZFIN has permission only to display this image to its users.
Additional permissions should be obtained from the applicable author or publisher of the image.
Full text @ Sci. Rep.