
- Title
-
Centrobin controls primary ciliogenesis in vertebrates
- Authors
- Ogungbenro, Y.A., Tena, T.C., Gaboriau, D., Lalor, P., Dockery, P., Philipp, M., Morrison, C.G.
- Source
- Full text @ J. Cell Biol.
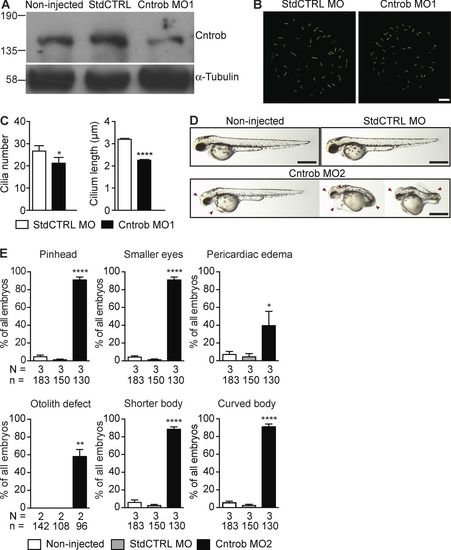
Centrobin loss causes ciliary and developmental defects in zebrafish embryos. MO1 was directed to the centrobin ATG and MO2 to the 5′ UTR. (A) Immunoblot analysis of efficacy of the centrobin knockdown in zebrafish embryos at 24 hpf. (B) Confocal stacks of cilia in KV in 8 ss zebrafish embryos injected with the standard control MO (StdCTRL MO) or MO targeting the translation start site of centrobin. Cilia were visualized with an antibody to acetylated tubulin (green). Bar, 10 µm. (C) Quantitation of ciliation frequency and length in KV after injection with the indicated MOs showing mean + SEM of four independent experiments in which 40 standard control MO and 33 Cntrob MO-treated KVs were quantitated by acetylated tubulin staining. In standard control embryos, 1067 cilia were measured, and in Cntrob MO embryos, 750 cilia. *, P < 0.01; ***, P < 0.0001; unpaired t test. (D) Live images show gross phenotypes of zebrafish embryos injected with control or Cntrob MOs at 24 hpf. Arrowheads indicate morphological abnormalities. Bars, 500 nm. (E) Quantitation of developmental phenotypes in centrobin-deficient embryos. Each phenotype was quantitated over three experiments in the indicated number of zebrafish embryos and graphs indicate means + SEM. *, P < 0.05; **, P < 0.01; ****, P < 0.0001, by one-way ANOVA. EXPRESSION / LABELING:
PHENOTYPE:
|
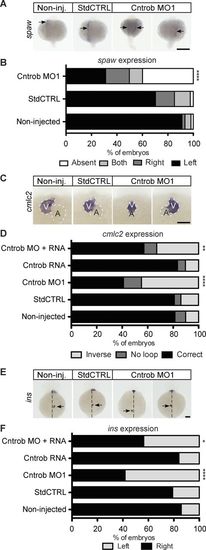
Centrobin loss causes laterality defects in zebrafish embryos. (A, C, and E) WMISH micrographs of showing localization of the messages of spaw for left lateral plate mesoderm, cmlc2 to indicate heart looping, and ins to label pancreata and assess abdominal situs development. Dashed line indicates midline. A, atrium; V, ventricle. Bars, 100 µm. (B) Quantitation of laterality of spaw expression (arrows) in WT embryos and embryos injected as indicated at 20–22 ss. Appropriate asymmetric expression is to the left. (D) Quantitation of appropriate heart looping in WT embryos and embryos injected as indicated at 48 hpf. (F) Quantitation of pancreas placement in WT embryos and embryos injected as indicated at 48 hpf. Correct placement is on the right side from the midline. *, P < 0.05; **, P < 0.01; ****, P < 0.0001. Significances were assessed using Fisher’s exact test. EXPRESSION / LABELING:
PHENOTYPE:
|
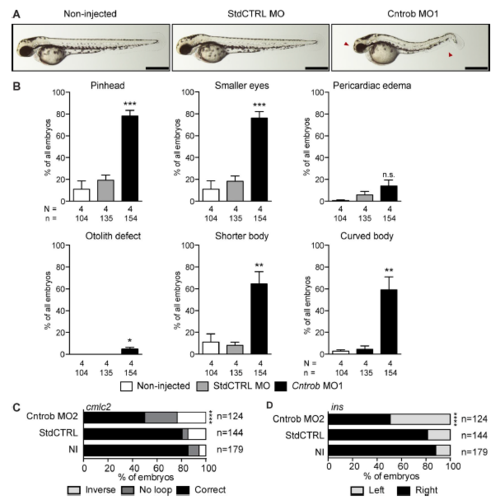
Reproduction of the zebrafish phenotypes with a second MO. MO1 was directed to the centrobin ATG and MO2 to the 5′ UTR. (A) Live images show gross phenotypes of zebrafish embryos injected with control or centrobin MOs at 48 hpf. Arrowheads indicate morphological abnormalities. Bars, 500 nm. (B) Quantitation of developmental phenotypes in centrobin-deficient embryos. Each phenotype was quantitated over three experiments in the indicated number of zebrafish embryos, and graphs indicate means + SEM. *, P < 0.05; **, P < 0.01; ****, P < 0.0001, by one-way ANO VA. (C) Quantitation of appropriate heart looping in WT embryos and embryos injected as indicated at 48 hpf. ****, P < 0.0001. Significances were assessed using Fisher’s exact test. (D) Quantitation of pancreas placement in WT embryos and embryos injected as indicated at 48 hpf. Correct placement is at right. ****, P < 0.0001. Significances were assessed using Fisher’s exact test. |