
Fig. S3
- ID
- ZDB-FIG-180705-74
- Publication
- Ogungbenro et al., 2018 - Centrobin controls primary ciliogenesis in vertebrates
- Other Figures
- All Figure Page
- Back to All Figure Page
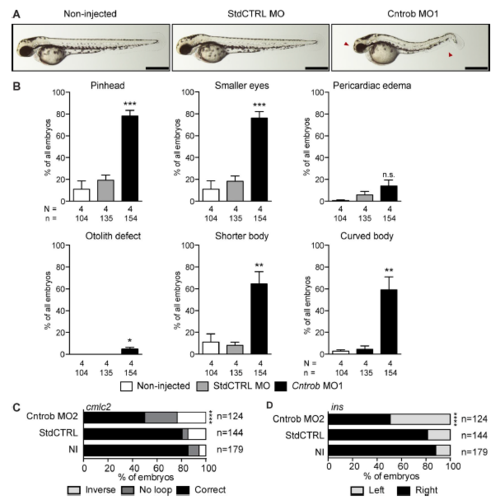
Reproduction of the zebrafish phenotypes with a second MO. MO1 was directed to the centrobin ATG and MO2 to the 5′ UTR. (A) Live images show gross phenotypes of zebrafish embryos injected with control or centrobin MOs at 48 hpf. Arrowheads indicate morphological abnormalities. Bars, 500 nm. (B) Quantitation of developmental phenotypes in centrobin-deficient embryos. Each phenotype was quantitated over three experiments in the indicated number of zebrafish embryos, and graphs indicate means + SEM. *, P < 0.05; **, P < 0.01; ****, P < 0.0001, by one-way ANO VA. (C) Quantitation of appropriate heart looping in WT embryos and embryos injected as indicated at 48 hpf. ****, P < 0.0001. Significances were assessed using Fisher’s exact test. (D) Quantitation of pancreas placement in WT embryos and embryos injected as indicated at 48 hpf. Correct placement is at right. ****, P < 0.0001. Significances were assessed using Fisher’s exact test. |