
- Title
-
Optical inhibition of larval zebrafish behaviour with anion channelrhodopsins
- Authors
- Mohamed, G.A., Cheng, R.K., Ho, J., Krishnan, S., Mohammad, F., Claridge-Chang, A., Jesuthasan, S.
- Source
- Full text @ BMC Biol.
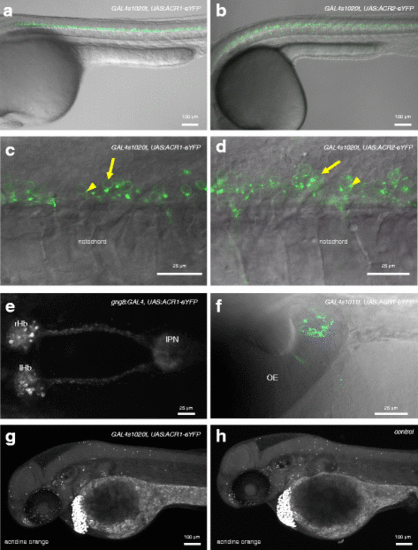
Expression of GtACR1 and GtACR2 in transgenic zebrafish. a, b Expression of GtACR1-eYFP in the trunk of 1-day-old GAL4s1020t, UAS:GtACR1-eYFP (a) and GAL4s1020t, UAS:GtACR2-eYFP (b) embryos. Labelled cells are located in the ventral regions of the spinal cord. c, d High magnification view of the trunk of fish expressing GtACR1-eYFP (c) or GtACR2-eYFP (d) in spinal neurons. There is label in the plasma membrane (arrows). For GtACR2, the label is dimmer. Puncta are visible (arrowheads). e An 8-dpf gng8:GAL4, UAS:GtACR1-eYFP larva, showing label in habenula neurons and in axons innervating the interpeduncular nucleus. f Expression of GtACR1-eYFP in olfactory neurons of a 3-day-old fish carrying the GAL4s1011t driver. g, h Forty-eight-hour-old embryos labelled with acridine orange. Dying cells are strongly labelled and appear as bright spots. These are detected in both GtACR1-expressing (g) and non-expressing (h) fish. There is no evidence of cell death in the ventral spinal cord of GtACR1-expressing fish. Anterior is to the left in all panels except f, where anterior is to the top. All panels are lateral views, except e and f, which are dorsal views. Panels a, c, d and f are single planes, while b, e, g and h are maximum projections. OE olfactory epithelium, IPN interpeduncular nucleus, lHb left habenula, rHb right habenula |
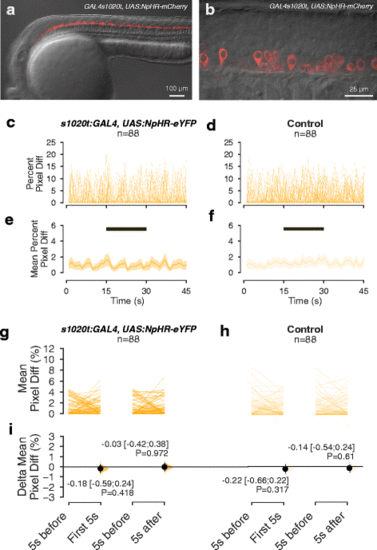
The effect of low intensity amber light on spontaneous movement of NpHR-expressing embryos. a, b Lateral view of a 24-h-old embryo expressing NpHR-mCherry under the 1020 GAL4 driver. a Overview of expression in the spinal cord. b. High magnification view, showing expression of NpHR-mCherry in spinal neurons. c–f Time course of movement of embryos, with (c, e) or without (d, f) halorhodopsin expression, in a 45-s recording with exposure to 15 s of amber light. The period of illumination is indicated by the black bar. c and d show movement of individual embryos, while e and f show mean values and 95% CIs. g, h Average amount of movement in the 5 s before light onset (‘5 s before’), in the first 5 s after light onset (‘First 5 s’) and in the first 5 s after light offset (‘5 s after’), in NpHR-expressing embryos (g) and non-expressing siblings (h). i Difference in movement in the first 5 s after light onset and after light offset, relative to the period before light, in NpHR-expressing and non-expressing embryos. Intensity of amber light used = 17 μW/mm2 |
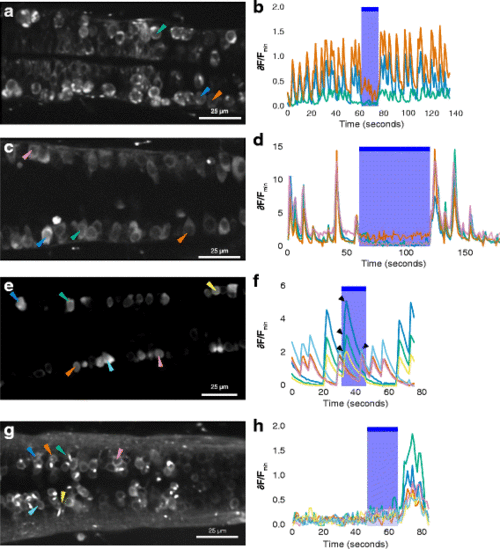
Calcium imaging of spinal neurons in GtACR1 embryos and non-expressing siblings. a Ventral spinal neurons of a 24-h-old 1020:GAL4, UAS:GtACR1-eYFP, elavl3:GCaMP6f embryo. The green arrowhead indicates a neuron with bright membrane label and puncta, suggesting expression of GtACR1-eYFP. The orange arrowhead indicates a neuron without GtACR1-eYFP expression. b Time course of fluorescence intensity in neurons, represented as change relative to minimum fluorescence. There is a reduction in activity during delivery of blue light. c, d Activity in dorsal spinal neurons, which do not express the GAL4 driver, in another 24-h-post-fertilization (hpf) GAL4s1020t, UAS:GtACR1-eYFP, elavl3:GCaMP6f embryo. Spontaneous activity was detected before and after, but not during, the period of blue light delivery. e, f Spontaneous activity in six neurons in a 26-h-old embryo with no GtACR1-eYFP expression. e Increase in fluorescence intensity occurs during the period of illumination with blue light (arrowheads). g, h The response of six spinal neurons in a 4-day-old embryo expressing GtACR1. There is no activity before light in these neurons, but there is a rise in GCaMP6f fluorescence after termination of the blue light. In panels b, d, f and h, the blue shaded region and bar indicate the period in which light was delivered. The colours of the traces represent relative change in fluorescence of the cells indicated by the arrowheads with the corresponding colours in the image on the left |