
- Title
-
Impaired Sleep, Circadian Rhythms and Neurogenesis in Diet-Induced Premature Aging
- Authors
- Stankiewicz, A.J., McGowan, E.M., Yu, L., Zhdanova, I.V.
- Source
- Full text @ Int. J. Mol. Sci.
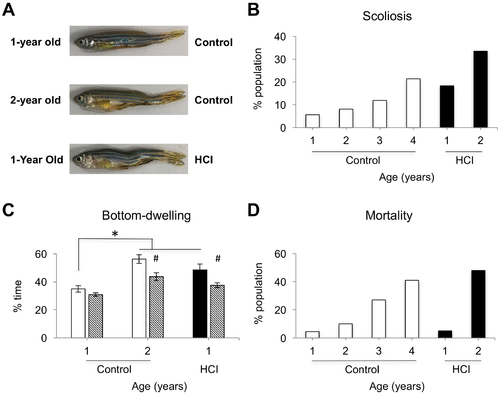
Figure 1. Premature aging phenotype in high caloric intake (HCI) zebrafish: anatomical and behavioral changes, and increased mortality. (A) Images of 1-year old Control, 2-year old Control and 1-year old HCI fish with scoliosis. (B) Percent of fish with scoliosis within each condition; white bar—Control fish, 1–4 years of age, black bar—HCI fish, 1–2 years of age. (C) Bottom-dwelling, time spent swimming at the bottom third of the tank, following no treatment (solid bar) or after Diazepam administration (diagonal stripes), n = 6–8 fish per group, mean ± SEM, * p < 0.05 vs. 1-year old Control; # p < 0.05 Diazepam vs. no treatment. (D) Mortality rate in 1–4 year old Control and 1–2 year old HCI fish (see Section 4.1. for the size of each population).
PHENOTYPE:
|

ZFIN is incorporating published figure images and captions as part of an ongoing project. Figures from some publications have not yet been curated, or are not available for display because of copyright restrictions. |
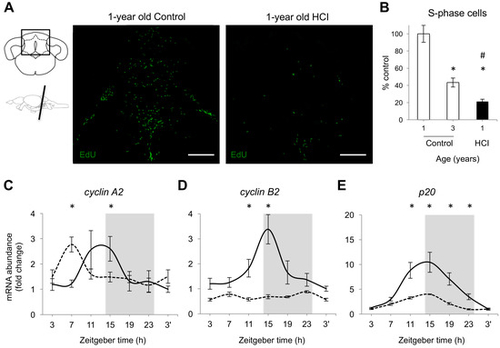
Figure 3. Chronic high caloric intake inhibits adult neurogenesis and expression of cell cycle regulators in brain tissue of 1-year old zebrafish. (A) Left: schematics showing cerebellar sections with boxes identifying areas presented in the images along with schematic of zebrafish brain identifying coronal planes at which the brain was cut; Right: representative images of the total number of 5-Ethynyl-2′-deoxyuridine (EdU) positive cells (S-phase), green, in Control and HCI fish at ZT11, following 2-h EdU exposure, intraperitoneal (i.p.) injection, Scale: 180 μm. (B) Percent cells in S-phase in 3-year old Control (white bar) and 1-year old HCI (black bar), relative to mean levels in 1-year old Control (100%, white bar); * p < 0.05 vs. 1-year old Control and # p < 0.05 vs. 3-year old Control; (C–E) Daily patterns of mRNA abundance for cyclins A2 and B2, and p20 in 1-year old Control (solid line) and HCI fish (dashed line); n = 5–6 fish per each data point; mean ± SEM, * p < 0.05 HCI vs. Control at specific time points. Grey background—night, 14:10 LD cycle. Zeitgeber time of sample collection, ZT0 = lights-on time.
|
|
ZFIN is incorporating published figure images and captions as part of an ongoing project. Figures from some publications have not yet been curated, or are not available for display because of copyright restrictions. |