
- Title
-
In Vivo Regulation of the Zebrafish Endoderm Progenitor Niche by T-Box Transcription Factors
- Authors
- Nelson, A.C., Cutty, S.J., Gasiunas, S.N., Deplae, I., Stemple, D.L., Wardle, F.C.
- Source
- Full text @ Cell Rep.
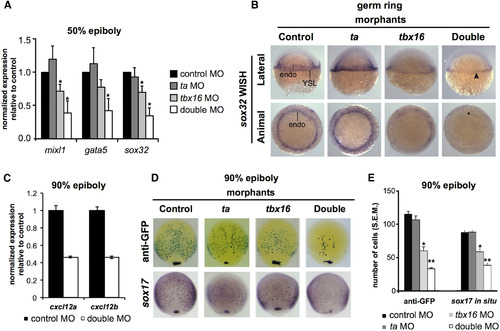
Loss of Ta and Tbx16 Leads to Downregulation of Endodermal Specifiers and Reduction of Endodermal Progenitors during Gastrulation (A) qPCR analysis of mixl1, gata5, and sox32 at 50% epiboly (5.3 hpf) in single and double ta/tbx16 morphants. All genes are significantly downregulated in double morphants; ∗p ≤ 5 × 10⁻²; Student’s t test. Data are represented as mean ± SEM. See also Figure S2. (B) WISH analysis of sox32 in single and double morphants at germ ring stage (5.7 hpf). Arrowhead, YSL expression; ∗, loss of endoderm expression. (C) Microarray analysis at 90% epiboly (9 hpf) indicates downregulation of cxcl12a/b. Data are represented as mean ± SEM. (D) Immunological and WISH analysis of a sox17:eGFP transgene and endogenous sox17 expression at 90% epiboly (9 hpf) in single and double morphants. (E) Cell numbers identified by immunostaining and WISH in (D). Cell numbers are representative of at least 20 embryos per condition. ∗p ≤ 1 × 10⁻⁸; ∗∗p ≤ 1 × 10⁻²⁰; Student’s t test. Data are represented as mean ± SEM. See also Figure S3. EXPRESSION / LABELING:
PHENOTYPE:
|
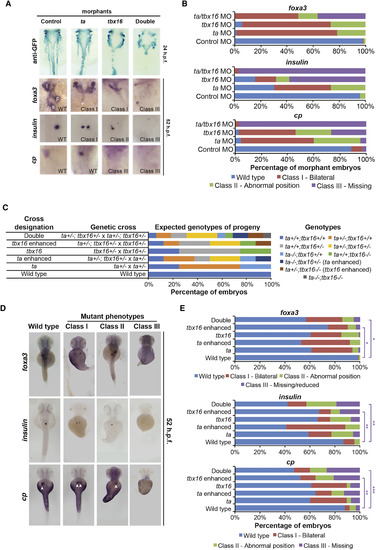
Ta and Tbx16 Are Redundantly Required for Liver, Pancreas, and Gut Development (A) GFP immunostaining in single and double morphant sox17:eGFP transgenic fish at 24 hpf and WISH analysis of broad endodermal organ marker foxa3, pancreas marker ins, and liver marker cp at 52–56 hpf in single and double morphants. l, liver; p, pancreas; s, stomach. Phenotypic classes as defined in (B) are indicated. (B) Percentage of KD embryos in each phenotypic class identified by WISH. Compare with Figure S3D. Graphs represent 19–124 embryos per group. (C) Genetic crosses and expected embryonic genotypes. Ta-enhanced (ta−/−;tbx16+/−) and tbx16-enhanced (ta+/−;tbx16−/−) genotypes are indicated. (D) Phenotypic classes of embryos from genetic crosses indicated in (C) identified by WISH. Arrowheads indicate liver cp staining. (E) Percentage of embryos in each phenotypic class from each genetic cross identified by WISH. Graphs represent 31–175 embryos per group. ∗p ≤ 3 × 10⁻²; ∗∗p ≤ 5 × 10⁻³; ∗∗∗p ≤ 1 × 10⁻⁴; all other comparisons with wild-type are not significant (p = 0.1–1); Fisher’s exact test. See also Figure S3. |
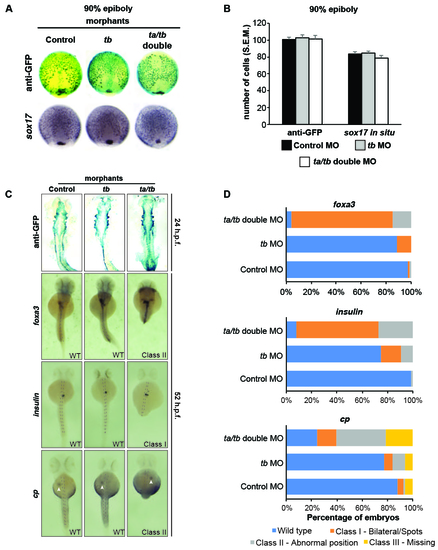
(Relates to Figures 4 and 5). Morpholino knockdown of Brachyury homologue Tb does not substantially enhance the Ta-mediated effects on endoderm progenitor numbers at 90% epiboly, but does enhance downstream laterality defects. (A) Immunological and WISH analysis of a sox17:eGFP transgene and endogenous sox17 expression at 90% epiboly (9 h.p.f.) in single and double morphants as indicated. (B) Quantification of cell numbers identified by immunostaining and WISH in panel A. Cell numbers are representative of at least 20 embryos per condition. (C) Anti-GFP immunostaining of flatmounted sox17:eGFP embryos at 24 h.p.f. and WISH analysis of broad marker of endodermal organs foxa3, pancreas marker ins and liver marker cp at 52-56 h.p.f. in single and double morphants. Examples of phenotypic classifications are indicated. WT = wild type. Dashed lines indicate the midline. (D) Phenotypic quantification of morphant embryos from panel C experiment. Each group is representative of at least 30 embryos. EXPRESSION / LABELING:
PHENOTYPE:
|