
- Title
-
Fatty Acid Oxidation in Zebrafish Adipose Tissue Is Promoted by 1α,25(OH)2D3.
- Authors
- Peng, X., Shang, G., Wang, W., Chen, X., Lou, Q., Zhai, G., Li, D., Du, Z., Ye, Y., Jin, X., He, J., Zhang, Y., Yin, Z.
- Source
- Full text @ Cell Rep.

ZFIN is incorporating published figure images and captions as part of an ongoing project. Figures from some publications have not yet been curated, or are not available for display because of copyright restrictions. |
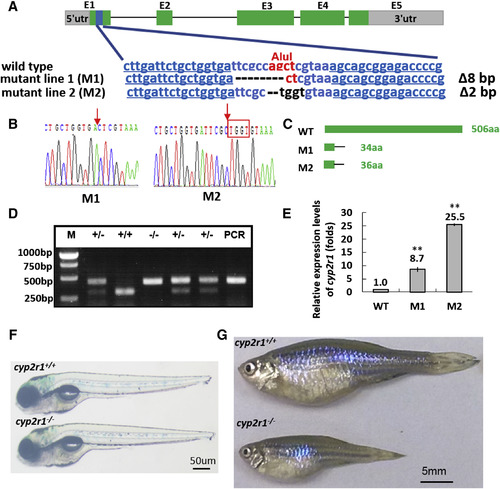
cyp2r1 Gene Depletion in Zebrafish by TALENs (A) The binding site of engineered TALENs on the cyp2r1 gene exon (E)1 (exons are in boxes). The underlined blue font indicates the sequences of the two targeting arms of TALENs, and the red font shows the restriction enzyme AluI cutting site. (B) Mutation confirmation, as shown by the sequencing results of the transcripts of cyp2r1 gene of M1 and M2. (C) A diagram representative of WT and two truncated mutant Cyp2r1 proteins. (D) An agarose gel electrophoresis image with the PCR products following AluI digestion of the cyp2r1 locus of F2 fish. +/+, WT; +/−, heterozygous; −/−, homozygous. (E) The relative expression levels of cyp2r1 in the adult livers of mutant lines and their control siblings. ∗∗p < 0.01, compared with the control group. (F and G) Comparison of the morphological features of the cyp2r1−/− fish and wild-type controls at (F) 5 dpf and (G) 100 dpf. See also Figure S2 and Tables S1 and S2. |
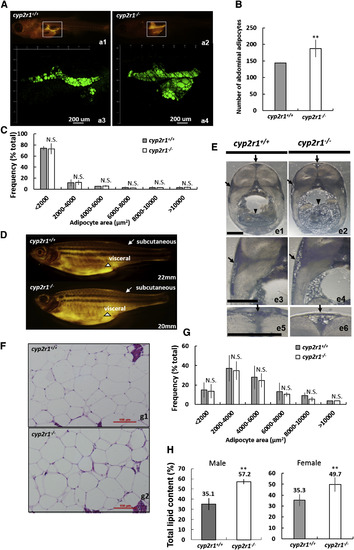
Excessive VAT Developed in cyp2r1-Deficient Fish (A) The neutral lipids of juvenile mutants and size-matched controls (both with a standard length of 7.6 mm) were stained with Nile Red and viewed with stereoscope (a1 and a2) and confocal microscope (a3 and a4). (B and C) Shown here: (B) visceral adipocyte numbers and (C) area frequency of VAT in the confocal view (a3 and a4). (D and E) Shown here: (D) Nile Red fluorescence and (E) cross-sections through trunks of adult mutants and their size-matched controls show increased subcutaneous AT (arrows) and excessive VAT (arrowheads) in the mutants. Scale bars, 1 mm. (F) H&E-stained sections of VAT of adult mutants and their size-matched controls. Scale bars, 100 μm. (G) Frequency distribution of adipocyte cell-surface area. (H) The total lipid contents of males and females of both mutants and age-matched controls at 100 dpf. cyp2r1+/+, n = 5; cyp2r1−/−, n = 4. Error bars indicate means ± SD. ∗∗p < 0.01; N.S., no statistically significant difference. See also Figure S3 and Table S3. PHENOTYPE:
|
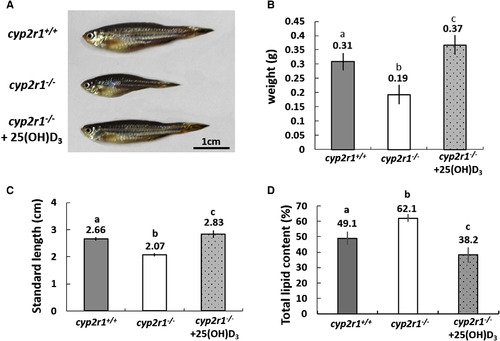
25(OH)D3 Rescue Experiments (A–D) Shown here: (A) the morphological features, (B) body weight, (C) standard length, and (D) total lipid contents of wild-type control, cyp2r1 mutant, and 25(OH)D3-treated cyp2r1 mutant fish at 100 dpf. N = 11. Error bars indicate means ± SD. The different letters above the bars indicate a significant difference at p < 0.01. PHENOTYPE:
|
|
ZFIN is incorporating published figure images and captions as part of an ongoing project. Figures from some publications have not yet been curated, or are not available for display because of copyright restrictions. |
|
ZFIN is incorporating published figure images and captions as part of an ongoing project. Figures from some publications have not yet been curated, or are not available for display because of copyright restrictions. |
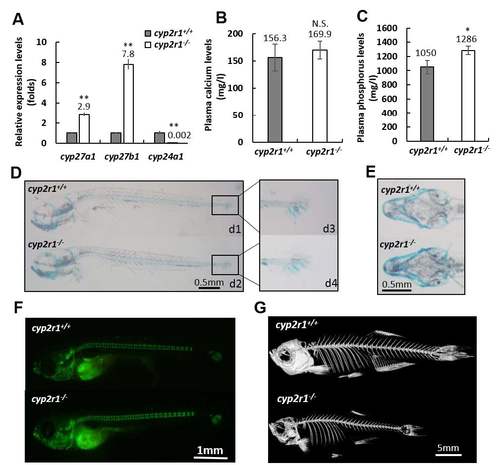
Expression levels of cyp27a1, cyp27b1 and cyp24a1 in the livers, calcium and phosphorus levels in plasma, and bone and cartilage. Related to Figure 2. (A) QRT-PCR assays show the increased cyp27a1 and cyp27b1 transcript levels and diminished cyp24a1 transcript levels in the livers of mutants and wild type siblings at 100 dpf. (B) Calcium and (C) phosphorus levels of plasma were measured in the mutants and wild type siblings at 100 dpf. (D, E) Alcian Blue for cartilage and (F) Calcein for bone staining of cyp2r1-/- zebrafish and the wild type siblings at 14 dpf. (G) MicroCT scanning of the mutants and control siblings at 100 dpf. The images are the representative result. D, lateral views; E, ventral views. The bars indicate means ± SD. *P< 0.05, **P< 0.01 versus controls, N.S., no statistically significant difference. EXPRESSION / LABELING:
PHENOTYPE:
|
|
ZFIN is incorporating published figure images and captions as part of an ongoing project. Figures from some publications have not yet been curated, or are not available for display because of copyright restrictions. PHENOTYPE:
|
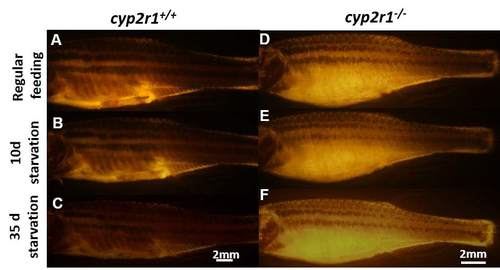
Impaired AT mobilization in cyp2r1-deficient fish during starvation. Related to Table 1. (A-F) AT was viewed with Nile-Red staining of cyp2r1-deficient fish (D, E, F) and their control siblings (A, B, C) at 100 dpf during starvation. cyp2r1+/+, cyp2r1-/-, n = 4 individuals. The image is one representative result. PHENOTYPE:
|
|
ZFIN is incorporating published figure images and captions as part of an ongoing project. Figures from some publications have not yet been curated, or are not available for display because of copyright restrictions. |
|
ZFIN is incorporating published figure images and captions as part of an ongoing project. Figures from some publications have not yet been curated, or are not available for display because of copyright restrictions. |
|
ZFIN is incorporating published figure images and captions as part of an ongoing project. Figures from some publications have not yet been curated, or are not available for display because of copyright restrictions. |
|
ZFIN is incorporating published figure images and captions as part of an ongoing project. Figures from some publications have not yet been curated, or are not available for display because of copyright restrictions. PHENOTYPE:
|
|
ZFIN is incorporating published figure images and captions as part of an ongoing project. Figures from some publications have not yet been curated, or are not available for display because of copyright restrictions. PHENOTYPE:
|