
- Title
-
The occhiolino (occ) mutant zebrafish, a model for development of the optical function in the biological lens
- Authors
- Aose, M., Linbo, T.H., Lawrence, O., Senoo, T., Raible, D.W., Clark, J.I.
- Source
- Full text @ Dev. Dyn.
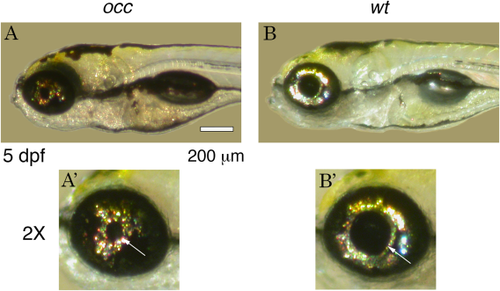
Phenotype of occhiolino (occ) and wt Zebrafish at 5 dpf. The occ Zebrafish resembled the wt except for the small diameter of the pupil and lens. A′ and B′ are magnifications of the eyes in A and B. Scale bar = 200 μm. PHENOTYPE:
|
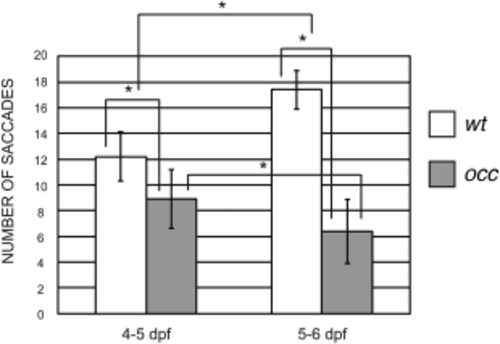
OKR characterized the effect of the occ mutation on saccades. The number of saccades in the occ mutant was significantly lower compared to those in wt. At 4–5 dpf, the number of saccade eye movements per 20 seconds in wt was 12.2 ± 1.9, and only 8.9 ± 2.3 in occ. Only 1 day later, at 5–6 dpf, the number of saccades in wt increased to 17.4 ± 1.5 but decreased to 6.4 ± 2.5 in occ, indicating poorer optical function in the mutant. Data were expressed as the mean ± SD. The differences between groups were significant at P < 0.05 (*). |
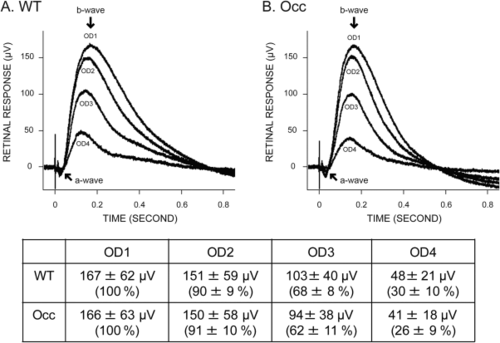
ERGs determined that retinal function in the occ mutant resembles that in the wt Zebrafish. ERGs were conducted on wt and occ eyes at 5–6 dpf using four different stimulus intensities. OD is the optical density, where OD1 is the brightest light intensity and OD4 is the lowest light intensity. In both wt (A) and occ (B), a negative a-wave followed by a large b-wave was a measure of the photoreceptors and postsynaptic activity (ganglion cells), respectively. The normalized response for each illumination was plotted in the figures, and the recorded values were listed in the table. The similarities in the magnitude and the response of the ERGs to different illumination indicated that visual function in the occ and wt retinas was the same. The visual deficit in the occ mutant was not the result of abnormal retinal function. |
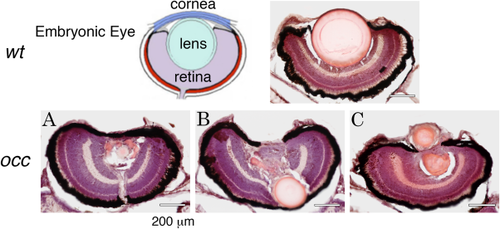
Although two lens masses formed in the occ eye, the retina appeared normal. The layered structure of the retina in the occ eye was similar in size to that of the wt. In the wt eye, the lens was large and spherically symmetric. In the occ eye, the primary lens remained intact and was displaced posteriorly, pushing into the developing retina (10-μm frozen sections were stained with H&E at 5 dpf. Scale bar = 200 μm.). The drawing of the embryonic eye is from Soules and Link, 2005 PHENOTYPE:
|
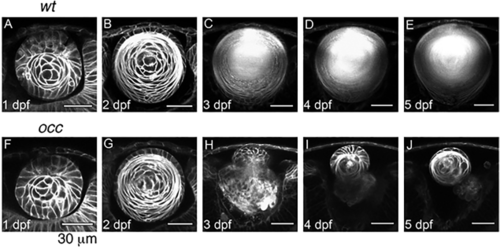
Lens Development in occ crossed with Q01. The 2-photon live-embryo imaging of lenses from wt and occ crossed to Q01 was conducted at 1, 2, 3, 4, and 5 dpf. The cornea is at the top of each image and the retina is at the bottom. The lens development in occ was the same as in the wt until 2– 3 dpf, when the lenticular cell mass separated from the surface ectoderm and the lens epithelial cells differentiated into secondary lens fibers. After 3 dpf, a nucleus began to form in the center of the wt lens, and the lens grew larger gradually and matured similar to an adult lens. In contrast, the lens in the occ eye was abnormal. Epithelial cells formed a second lenticular cell mass on the anterior side of the first lens, and the first lens began degenerating at 3 dpf. At 4–5 dpf, the secondary lens cell mass resembled a normal 2-dpf lens. See Suppl. Movies 1–3. Scale bar = 30 μm. |
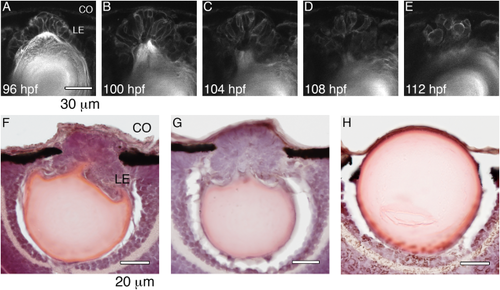
Formation of the second lens cell mass in occ. 2-photon live-embryo images of an occ eye were compared with 10-μm frozen sections stained with H&E of occ and wt eyes. The cornea is at the top of each image and the retina is at the bottom. The lens epithelial cells were observed in the developing lens in occ eyes from 4 to 6 dpf (A–E). In the occ eye, the lens epithelial cells were multilayered and formed a cell mass secondary to the original lens (F,G). In the wt eye, the lens epithelial cells formed a single layer inside of the lens capsule (H). CO, cornea; LE, lens epithelial cells. Scale bar = 30 μm for A–E, and = 20 μm for F–H. PHENOTYPE:
|
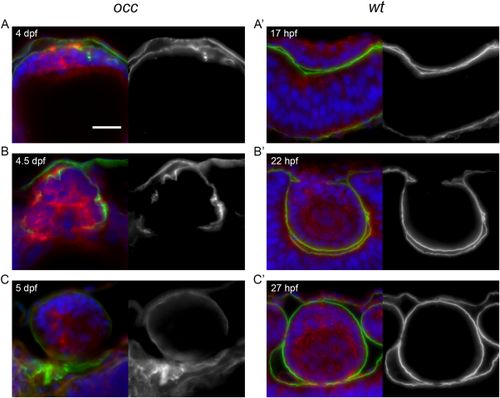
Disruption of basement membrane (capsule) integrity in the mutant occ lens. When the epithelial cells of the occ lens became multilayered at 4 dpf, the basement membrane appeared as a thin disorganized layer on the external surface of the lens mass. By 4–5 dpf (A–C), a thin capsule was developing to surround the occ lens and appeared to be distributed irregularly around the lens cell mass. Apparently, the discontinuities in the basement membrane destabilized the structure enough to permit epithelial cells to form a secondary cell mass by 5 dpf. In contrast, the basement membrane of the wt lens formed a thick, prominent, and continuous capsule surrounding the lens mass as early 22 hpf (A′,B′), indicating the earliest stages of lens capsule development. Sections were labeled for laminin (green), actin (red), and DAPI (blue) and shown with corresponding monochrome images (to the right) of the green laminin channel only. Approximate ages are listed in each section. Scale bar = 20 μm. |
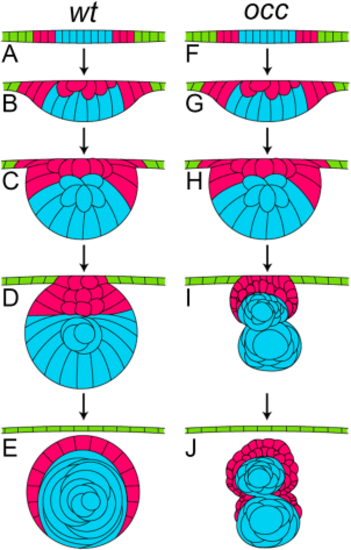
Comparison of the developmental stages for lens in wt and occ Zebrafish. In this diagram, the developmental stages of the lens in a wt eye (A–E) were compared with the developmental stages of the lens in the eye of an occ mutant (F–J). In the early developmental stages, the lens cell mass delaminated normally from the surface ectoderm in the wt and occ eyes, and the lens epithelial cells began differentiating into secondary lens fibers (A–C, F–H). In the occ eye, the multilayered epithelial cells formed a secondary mass of cells anterior to the surface of the developing lens (I). By 4 dpf, the wt lens formed a core of well-defined nuclear cells surrounded by an epithelium and continued to develop normally to become a functioning adult lens (D,E). In the occ eye, a small secondary cellular mass became ordered and multilayered as the other lens degenerated (I,J). With further development, the secondary mass of epithelial cells in the occ mutant differentiated into the lens fiber cells (J). The abnormal development of the occ lens accounted for the abnormal visual function in the occ mutant. While there was variability, the drawings represent the developmental stages observed using live-embryo imaging and histology. (See Suppl. Movies 1–3.) |

Unillustrated author statements PHENOTYPE:
|