
- Title
-
Acute podocyte injury is not a stimulus for podocytes to migrate along the glomerular basement membrane in zebrafish larvae
- Authors
- Siegerist, F., Blumenthal, A., Zhou, W., Endlich, K., Endlich, N.
- Source
- Full text @ Sci. Rep.
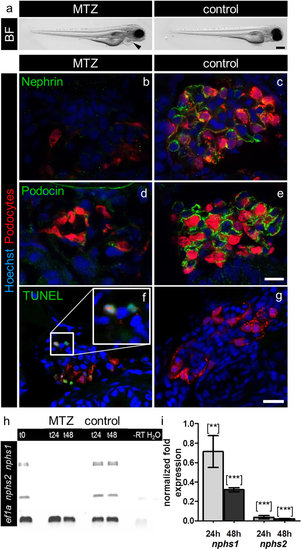
MTZ-treatment induces pericardial edema and downregulation of nephrin and podocin and podocyte apoptosis. Picture a shows (a) bright field (BF) image of a Cherry larva at 4 dpf after 24 hours 5 mM MTZ treatment that developed pericardial edema (arrowhead) in contrast to a 0.1% DMSO treated control larva exhibiting a normal phenotype. Panels b–e show confocal micrographs of immunofluorescence staining for nephrin and podocin of Cherry 4 dpf treated for 20 hours with 5 mM MTZ or 0.1% DMSO (control). Control glomeruli show pronounced staining for nephrin and podocin as well as a normal glomerular appearance, whereas glomeruli after MTZ treatment show decreased mCherry (podocytes) fluorescence as well as weak staining for nephrin and podocin (representative images of n = 3 individual experiments, scale bar represents 10 μm). Using TUNEL assay, we investigated the appearance of cell-death in MTZ treated (f) and control larvae (g). MTZ treated larvae show positive TUNEL staining, which co-localize with the nuclei of remaining podocytes (f, insert). The control larvae do not show glomerular TUNEL staining. The findings of the immunofluorescence staining could be verified on mRNA level by RT-PCR for nphs1 and nphs2 with eef1a1l1 (ef1a) as reference gene. After 24 hours treatment in 10 mM MTZ (t24) and following 24 hours washout in E3 medium (t48) the band intensities after RT-PCR of nphs1 and nphs2 were significant weaker compared to control (panel h). Quantitative RT-PCR for both target genes with eef1a1l1 and zgc:158463 as reference genes showed 0.71 (SD = 0.23) fold expression of nphs1 and 0.04 fold expression (SD = 0.016) of nphs2 compared to control after 24 hours 10 mM MTZ. After 24 hours regeneration in E3 medium the effect further increased as nphs1 was expressed 0.32 fold (SD = 0.03) and nphs2 0.02 fold (SD = 0.004) compared to control (panel i). Mean value of n = 3 experiments, the error bars indicate standard deviation, [**] p < 0.01; [***] p < 0.001. |
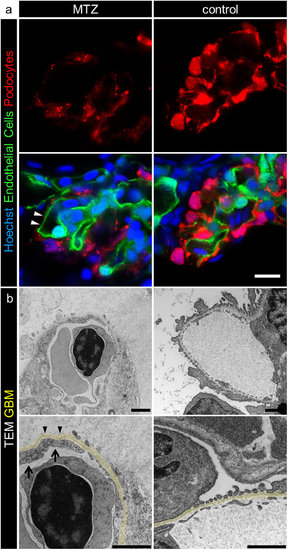
MTZ treatment leads to denudation of the GBM. Panel a shows denudation of glomerular capillaries after 16 hours exposure to 5 mM MTZ of Chipper (Tg(fli1a:eGFP); Tg(nphs2:Eco.NfsB-mCherry); mitfaw2/w2; roya9/a9) while control larvae showed uniform covering with mCherry positive podocytes (scale bar represents 10 μm). The phenotype in transmission electron micrographs of 4 dpf Cherry larvae after 24 hours MTZ treatment verified these findings (panel b), as broad areas of the GBM (arrowheads) were denuded, while control larvae showed normal morphology with foot processes and filtration slits. Endothelial cells of denuded areas showed significant fewer fenestrations (arrows). Note the higher contrasted Bowman’s space in 5 mM MTZ group compared to control caused by proteinaceous fluid due to leakiness of the glomerular filter (scale bar represents 1 μm, yellow = GBM, representative images from n = 3 experiments). |
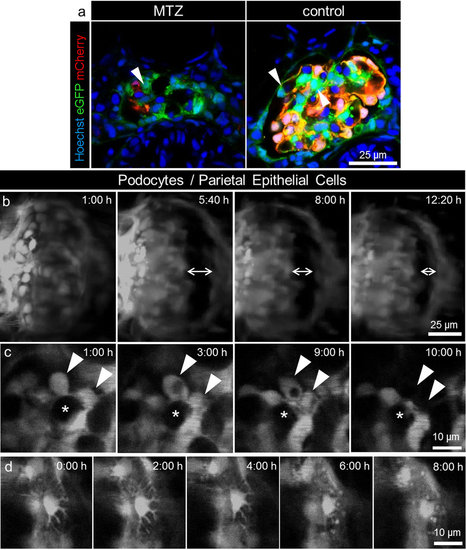
Long term in vivo two-photon imaging of podocyte injury. The pictures of panel a show that a subset of podocytes (arrowheads) in Chet larvae at 4 dpf only express eGFP and not NTR-mCherry and therefore are not vulnerable to MTZ treatment (representative image of n = 3 experiments, scale bar represents 25 μm). Panel b shows the morphological changes in the glomerulus during treatment with 5 mM MTZ as seen in the 3D reconstructions of long term 2-PM of Chet larvae beginning at 4 dpf. After approximately 5 hours, dilation of Bowman’s space occurred which decreased in the following time as shown by the double arrows at t = 5:40, 8:00, 12:20 hours (scale bar represents 25 μm). Panel c shows single frames of the detachment of two adjacent podocytes (arrowheads) between t = 9 and 10 hours (asterisks indicate a capillary loop which is covered by podocytes, scale bar represents 10 μm). The time series of single frames over 8 hours in panel d shows retraction of major processes of a single podocyte during treatment with 5 mM MTZ (scale bar represents 10 μm). |
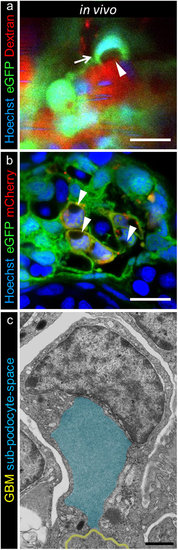
Subpodocyte space pseudocysts form during treatment with MTZ. 2-PM of 0.5 mg/ml Hoechst 33342 and 25 mg/ml TRITC-dextran injected Chet larvae at 5 dpf revealed pseudocysts (a, arrowhead, scale bar represents 10 μm) within the cell bodies and nuclei that were pushed aside (a). The parachute-like pseudocysts have a basal opening to the GBM and are encapsulated by podocyte cell bodies (a, arrow). The striped Hoechst signal in capillaries is due to blood flow of nucleated erythrocytes in living larvae (representative images of n = 4 individual experiments, scale bar represents 5 μm). The appearance of pseudocysts was consistent with findings in confocal laser scanning microscopy of cross sections after 3 hours 5 mM MTZ treatment of 4 dpf Chet larvae as seen in picture (b), while control treated larvae did not show any pseudocysts (Supplementary Figure 6b,c, representative images of n = 3 individual experiments). Transmission electron microscopy further revealed the ultrastructural composition of these pseudocysts as exemplarily shown in picture c. Injured podocytes showed a basal opening to the GBM (yellow) and large pseudocysts (blue) which were encapsulated by the podocyte cell bodies (scale bar represents 1 μm, representative image from n = 3 experiments). |
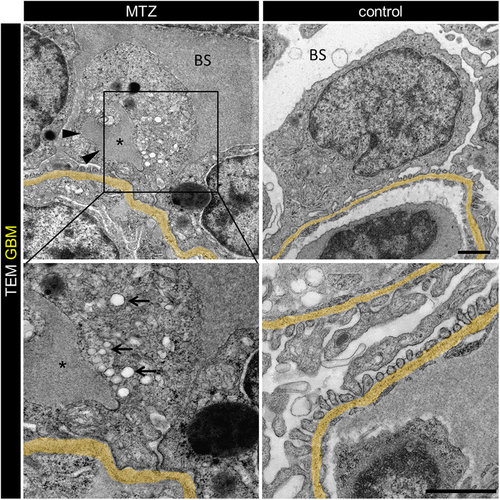
Injured podocytes show increased endocytosis from subpodocyte space dilatations. Transmission electron micrographs of 3 hours 5 mM MTZ treated Cherry larvae showed appearance of pseudocysts (arrowheads) and numerous endosomes (arrows) close to the pseudocysts (lumen marked with asterisk). Additionally those larvae showed broad effacement of foot processes. In contrast, control treated larvae (0.1% DMSO) showed normal glomerular morphology with regular foot processes and slit diaphragms in between. Note the electron dense Bowman’s space (BS) in MTZ treated larvae (scale bars represent 1 μm, representative images from n = 3 experiments). PHENOTYPE:
|
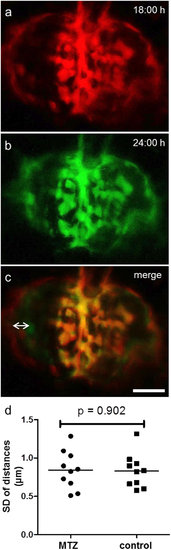
Migration-analysis reveals static behavior of remaining podocytes. For evaluation of possible migration we captured 3D images of different points in time as seen for t = 18 hours (a) and t = 24 hours (b). The merged pictures in c show that the parietal epithelial cells do not match (double arrow) as Bowman’s space edema resolves over time. In contrast, podocytes on the glomerular tuft show no change of their position between the single points in time (scale bar represents 25 μm). The diagram in d shows the mean standard deviations of the podocytes distances measured over 15 hours for up to 18 different time points. The mean SD was 0.84 μm for MTZ and 0.83 μm for the DMSO control group (n = 10 per group). There was no significant difference between groups (p = 0.902). |
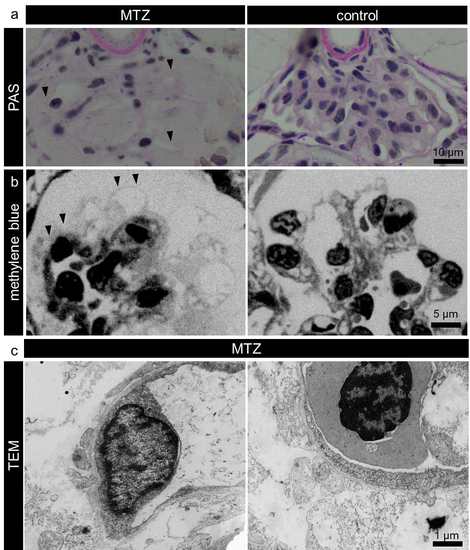
The denudation of the GBM. The PAS stained sections in panel a shows that broad areas of the glomerular capillaries were denuded and not covered by podocytes (a, arrowheads). Methylene blue stained semithin sections (panel b) showed absence of podocytes from the glomerular capillaries (b, arrowheads). Panel c shows additional transmission electron micrographs to Figure 2 b. |
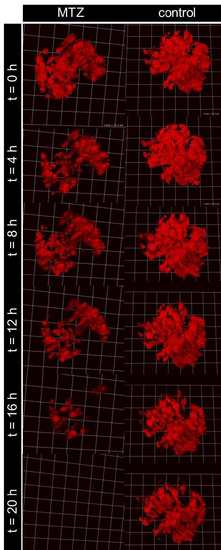
20 hours treatment with MTZ of 4 dpf Cherry larvae during 2-PM leads to massive loss of mCherry positive podocytes as indicated by the decrease of fluorescence. Besides that, the fluorescence of control (0.1% DMSO) also decreases due to bleaching effects because of the relatively short two-photon excitation wavelength of 760 nm. |

Picture a shows a 2-PM of a Chet larva which was pre-treated with MTZ for 3 hours. A few pseudocysts (asterisks) can be distinguished with different dextran fluorescence intensities (red, scale bar represents 10 μm). Panel b shows the control confocal laser scanning micrographs to Figure 4 b. Compared to MTZ treated larvae, controls did not show pseudocysts and normal glomerular morphology (scale bar represents 5 μm). The pictures of the methylene blue stained semithin sections in panel c confirm the appearance of these pseudocysts, as multiple encapsulated holes (asterisks) could be distinguished in MTZ treated larvae, whereas control glomeruli looked normally (scale bar represents 10 μm). |