
|
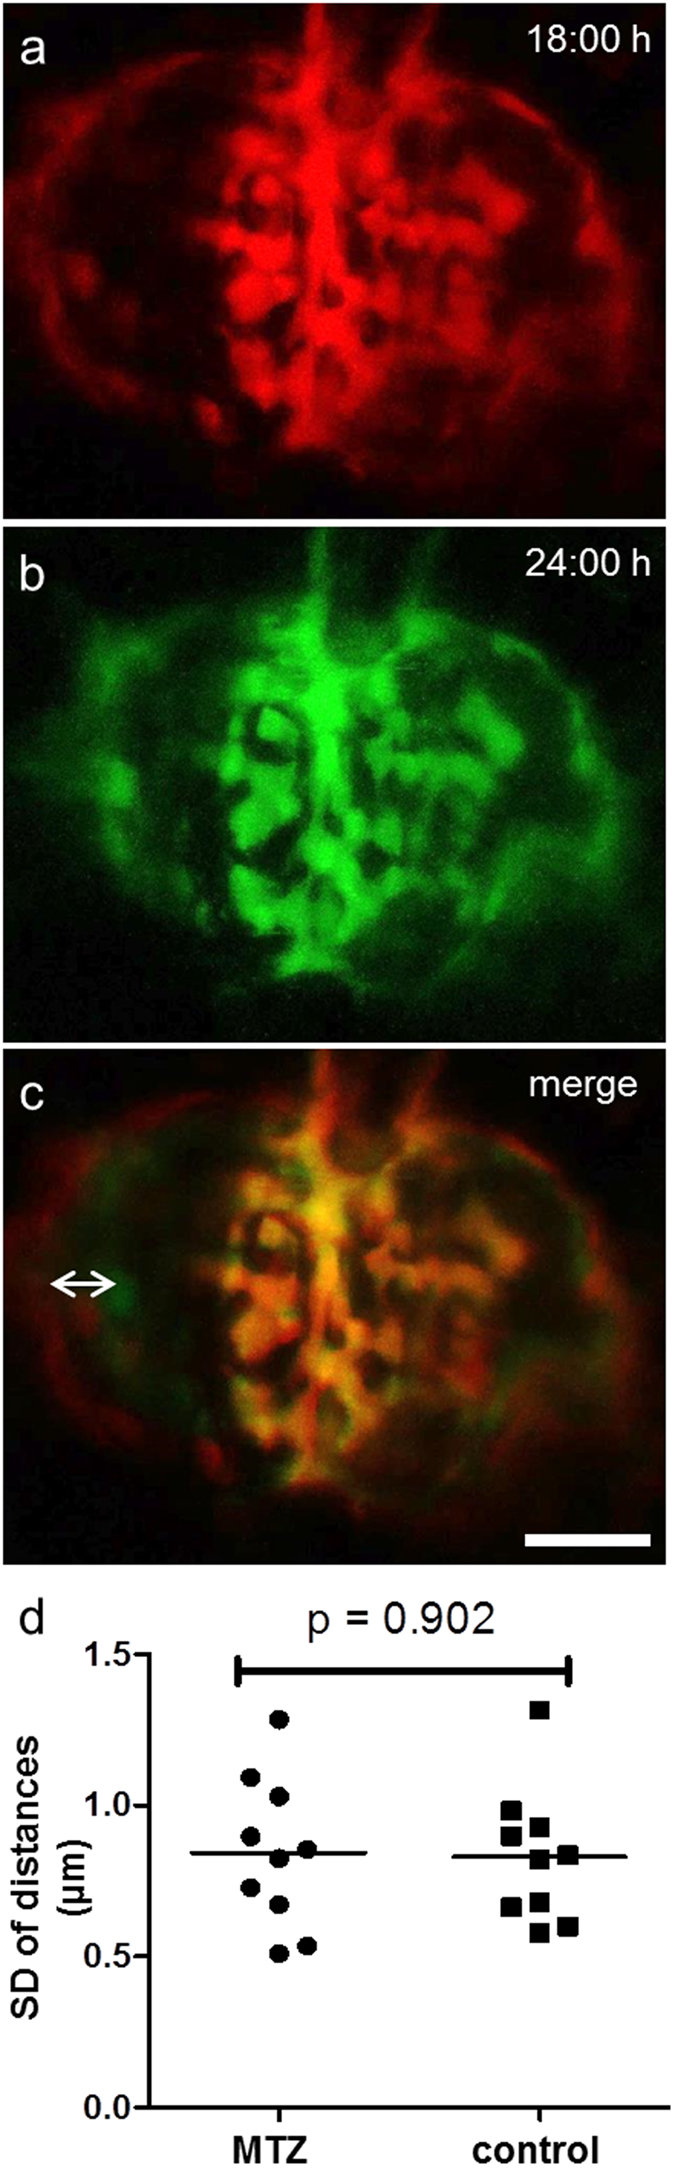
Fig. 6
Migration-analysis reveals static behavior of remaining podocytes.
For evaluation of possible migration we captured 3D images of different points in time as seen for t = 18 hours (a) and t = 24 hours (b). The merged pictures in c show that the parietal epithelial cells do not match (double arrow) as Bowman’s space edema resolves over time. In contrast, podocytes on the glomerular tuft show no change of their position between the single points in time (scale bar represents 25 μm). The diagram in d shows the mean standard deviations of the podocytes distances measured over 15 hours for up to 18 different time points. The mean SD was 0.84 μm for MTZ and 0.83 μm for the DMSO control group (n = 10 per group). There was no significant difference between groups (p = 0.902).