
Fig. 1
- ID
- ZDB-FIG-170425-27
- Publication
- Siegerist et al., 2017 - Acute podocyte injury is not a stimulus for podocytes to migrate along the glomerular basement membrane in zebrafish larvae
- Other Figures
- All Figure Page
- Back to All Figure Page
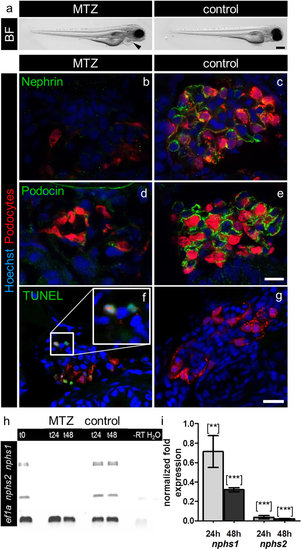
MTZ-treatment induces pericardial edema and downregulation of nephrin and podocin and podocyte apoptosis. Picture a shows (a) bright field (BF) image of a Cherry larva at 4 dpf after 24 hours 5 mM MTZ treatment that developed pericardial edema (arrowhead) in contrast to a 0.1% DMSO treated control larva exhibiting a normal phenotype. Panels b–e show confocal micrographs of immunofluorescence staining for nephrin and podocin of Cherry 4 dpf treated for 20 hours with 5 mM MTZ or 0.1% DMSO (control). Control glomeruli show pronounced staining for nephrin and podocin as well as a normal glomerular appearance, whereas glomeruli after MTZ treatment show decreased mCherry (podocytes) fluorescence as well as weak staining for nephrin and podocin (representative images of n = 3 individual experiments, scale bar represents 10 μm). Using TUNEL assay, we investigated the appearance of cell-death in MTZ treated (f) and control larvae (g). MTZ treated larvae show positive TUNEL staining, which co-localize with the nuclei of remaining podocytes (f, insert). The control larvae do not show glomerular TUNEL staining. The findings of the immunofluorescence staining could be verified on mRNA level by RT-PCR for nphs1 and nphs2 with eef1a1l1 (ef1a) as reference gene. After 24 hours treatment in 10 mM MTZ (t24) and following 24 hours washout in E3 medium (t48) the band intensities after RT-PCR of nphs1 and nphs2 were significant weaker compared to control (panel h). Quantitative RT-PCR for both target genes with eef1a1l1 and zgc:158463 as reference genes showed 0.71 (SD = 0.23) fold expression of nphs1 and 0.04 fold expression (SD = 0.016) of nphs2 compared to control after 24 hours 10 mM MTZ. After 24 hours regeneration in E3 medium the effect further increased as nphs1 was expressed 0.32 fold (SD = 0.03) and nphs2 0.02 fold (SD = 0.004) compared to control (panel i). Mean value of n = 3 experiments, the error bars indicate standard deviation, [**] p < 0.01; [***] p < 0.001. |
| Genes: | |
|---|---|
| Fish: | |
| Condition: | |
| Anatomical Terms: | |
| Stage Range: | Day 4 to Day 5 |
| Fish: | |
|---|---|
| Condition: | |
| Observed In: | |
| Stage Range: | Day 4 to Day 5 |