
- Title
-
Vegfa Impacts Early Myocardium Development in Zebrafish
- Authors
- Zhu, D., Fang, Y., Gao, K., Shen, J., Zhong, T.P., Li, F.
- Source
- Full text @ Int. J. Mol. Sci.
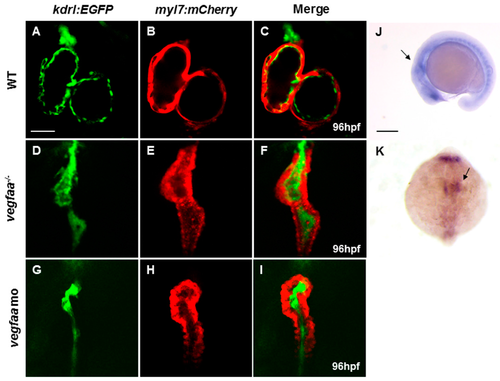
Vascular endothelial growth factor Aa (vegfaa) deficiency disrupts myocardial and endocardial morphogenesis. (A–I) Fluorescence micrographs of the hearts of wild-type (A–C), vegfaa mutant (D–F), and vegfaa morphants (G–I) at 96 hpf (hours post-fertilization) with the background of Tg(myl7:mCherry)/Tg(kdrl:EGFP) transgenic fish. The whole heart is substantially small and linearized in the mutant and the morphant, and no cavity is visible inside the heart lumen. Scale bar: 50 μm (A– I); (J,K) In situ hybridization of vegfaa in wild-type embryos at 18-somite stage. vegfaa is expressed in anterior lateral plate mesoderm as indicated by the arrow. (J) Lateral views, (K) Dorsal views with the anterior at the top. Scale bar: 200 μm (J,K). WT, wild-type; mo, morpholino EXPRESSION / LABELING:
PHENOTYPE:
|
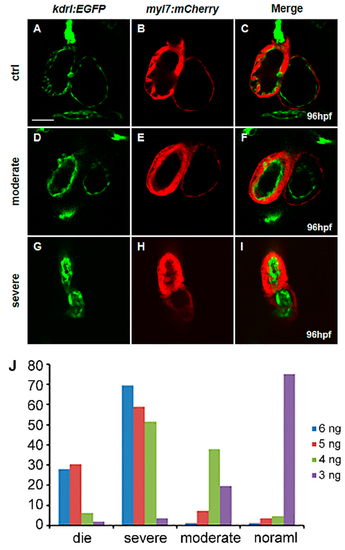
vegfaa regulates heart development in a dose-dependent manner. (A–I) Fluorescence micrographs of the hearts of wild-type (A–C), vegfaa morphants with moderate defects (D–F), and severe defects (G–I) at 96 hpf in the background of Tg(myl7:mCherry)/Tg(kdrl:EGFP) transgenic fish, Scale bar: 50 μm; (J) Statistical analysis of MO dosage and heart malformation in vegfaa morphants. |
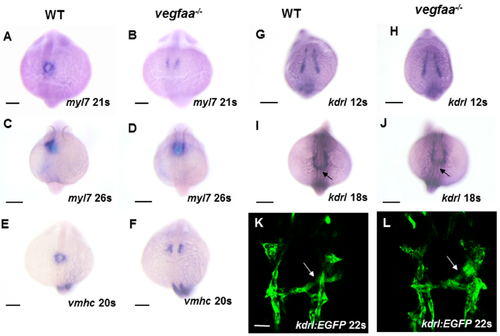
vegfaa mutants display defects in cardiomyocytes fusion. (A–D) In situ hybridization depicts myl7 expression at 21- and 26-somite stage in wild-type embryos (A,C) and vegfaa mutant embryos (B,D). At 21-somite stage, the wild-type cardiomyocytes formed a ring (A), whereas few cardiomyocytes are formed in the vegfaa mutants (B). At 26-somite stage, the wild-type primitive heart tube begins left looping (C) while vegfaa mutant embryos are still cardiac cone (D); (E,F) In situ hybridization depicts ventricular myosin heavy chain (vmhc) expression at 20-somite stage in wild-type embryos (E) and vegfaa mutant embryos (F); (G–J) Dorsal views depict unaffected endocardial expression pattern of kdrl in vegfaa mutants. Black arrows indicate midline migration of endocardial cells; Scale bar: 200 µm (A–J); (K,L) Dorsal views depict endocardial expression of Tg(kdrl:EGFP) at the 22-somite stage. White arrows indicate leftward movement. Scale bar: 50 µm. EXPRESSION / LABELING:
PHENOTYPE:
|
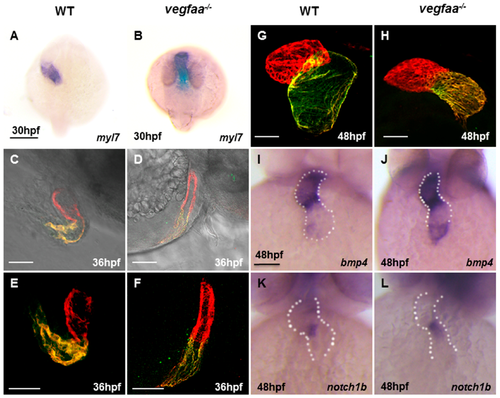
vegfaa deficiency results in defects in cardiac looping and chamber formation. (A,B) Dorsal views of in situ hybridization depicts myl7 expression at 30 hpf in wild-type embryos (A) and vegfaa mutant embryos (B). Scale bar: 200 μm (A,B); (C–F) Lateral views of zebrafish hearts stained with MF20 (red) and S46 (green) antibodies to visualize the ventricle and atrium at 36 hpf. MF20 marks the whole heart, whereas S46 is atrium-specific. Scale bar: 50 μm. (C,D) are added with light microscopy; (G–H) At 48 hpf, the wild-type heart is looped, with morphologically distinct chambers, whereas the vegfaa mutant heart appears unlooped, with a small heart, especially ventricle. Scale bar: 50 μm (C– H); (I–L) Frontal views depict expression of the atrio-ventricular canal (AVC) markers in wild-type (I,K) and in vegfaa mutants (J,L) at 48 hpf. Dotted lines outline the chambers flanking the AVC. Scale bar: 100 μm (I–L). |
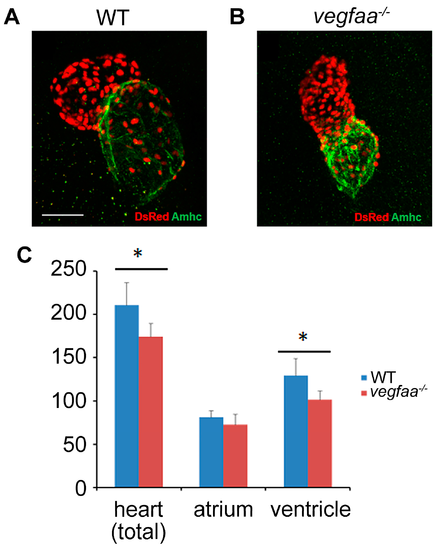
vegfaa promotes cardiomyocytes proliferation. (A,B) Immunofluorescence indicates the expression of transgene Tg(myl7:nDsRed) (red) in both cardiac chambers facilitating cardiomyocyte counting at 48 hpf. Atria are labeled with the anti-Amhc (atrial myosin heavy chain) antibody S46 (green); (C) Bar graphs indicate the number of atrial and ventricular cardiomyocyte nuclei, as well as the total number of cardiomyocytes; asterisks indicate statistically significant differences compared to wild-type (p < 0.05) (WT n = 5; vegfaa−/− n = 5). |
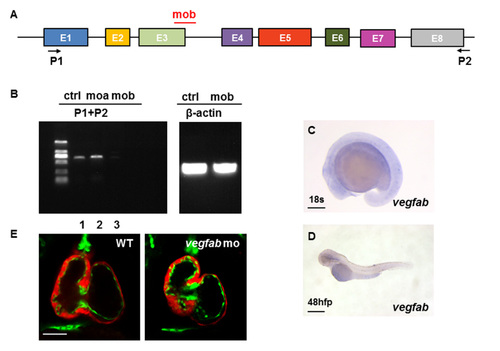
vegfab is not involved in early cardiovascular development in zebrafish. (A) Open boxes and black lines denote exons and introns of the early coding and non-coding region of vegfab. MO in red mark the target sites of the vegfab translation blocking. P1 and P2 indicate the sites of primers; (B) Fragments of vegfab sequences were amplified using the indicated primers. In vegfab morphant embryos, the normal vegfab RT-PCR product was not detected (lane 3). β-actin cDNA was also amplified from each sample as an internal control; (C,D) The expression of vegfab during early embryogenesis cannot be detected. Scale bar: 200 μm (C); 500 μm (D); (E) The heart development is almost normal with 10ng doses of vegfab MO at 96 hpf under the background of Tg(myl7:mCherry)/Tg(kdrl:EGFP) transgenic fish. Scale bar: 50 μm. |
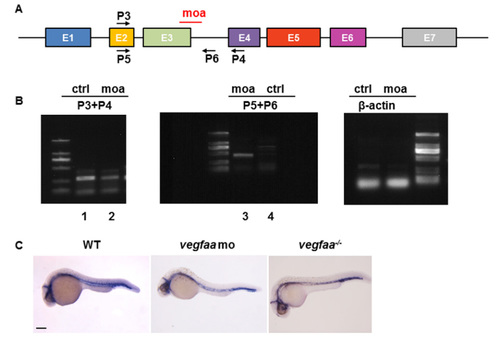
RT-PCR validation of morpholino efficacy for vegfaa. (A) Open boxes and black lines denote exons and introns of the first coding and non-coding region of vegfaa. MO in red mark the target sites of the vegfaa translation blocking. P3, P4, P5, and P6 indicate the sites of primers; (B) One- to two-cell embryos were injected with vegfaa MO, and cDNA at 24 hpf was isolated. In wild-type embryos, the normal vegfaa spliced P3–P4 RT-PCR product was observed (lane 1) but not the P5–P6 splice donor site PCR product (lane 3). In vegfaa morphants, the normal transcrpiction level is decreased (lane 2) and the intron sequences are retained (lane 3). The β-actin cDNA was also amplified from each sample as a reference control; (C) Whole-mount in situ hybridizations (WISH) analysis of cdh5 in WT, vegfaa morphants, and mutants at 30 hpf. The morphants and mutants display identical phenotype in arterial-venous differentiation and intersegmental vessel sprouting. Scale bar: 200 μm. |
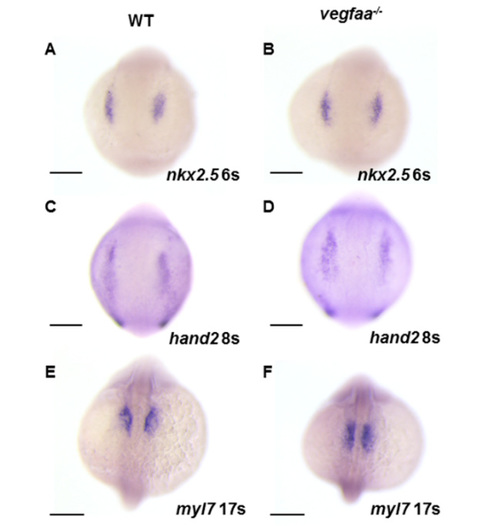
Normal pattern of cardiac progenitors and differentiation in vegfaa mutant embryos. (A–D) WISH demonstrates the expression of nkx2.5 (A,B) and hand2 (C,D) in wild-type (A,C) and vegfaa mutant (B,D) embryos; (E,F) WISH demonstrates the expression of myl7 in wild-type (E) and vegfaa mutant (F) embryos at 17-somite stage. Dorsal views anterior to the top. Gene expression patterns appear normal in vegfaa mutants; no expansion or reduction of heart field size is evident. Scale bar: 200 μm (A–F). |