
- Title
-
Ftr82 Is Critical for Vascular Patterning during Zebrafish Development
- Authors
- Chang, H.W., Wang, W.D., Chiu, C.C., Chen, C.H., Wang, Y.S., Chen, Z.Y., Liu, W., Tai, M.H., Wen, Z.H., Wu, C.Y.
- Source
- Full text @ Int. J. Mol. Sci.
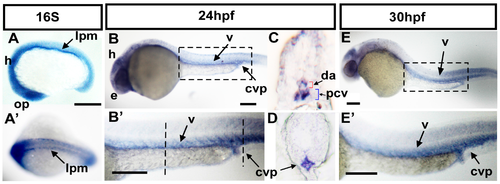
Expression pattern of ftr82 mRNA during zebrafish development. (A) Lateral view of ftr82 mRNA expression is observed at the 16 somite (16S) stage in the brain, optic placode (op), and lateral plate mesoderm (lpm); (A’) Dorsal view of embryos shows that ftr82 is expressed in two bilateral stripes of presumptive angioblasts within lpm; (B,B’); At 24 h post-fertilization (hpf), ftr82 is expressed in brain, eye (e) of the head, and in vessels (v) and caudal vein plexus (CVP) of the trunk; (B’) is an expanded image of B; (C,D) Transverse sections of embryo trunk and tail region from B’ show that ftr82 is expressed in dorsal aorta (da), posterior cardinal vein (pcv), and CVP; (E,E’) At 30 hpf, ftr82 expression continues in the head, vessels (v), and CVP of the trunk; (E’) is an expanded image of E. Scale bars are 200 µm. EXPRESSION / LABELING:
|
|
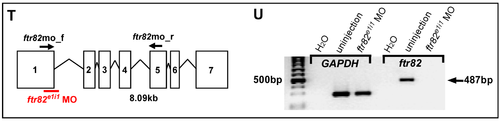
Knockdown of ftr82 causes vascular defects by using splicing block morpholino. (A,B) Bright field images of uninjected control and ftr82e1i1 morpholino injection at 26 hpf; (C–H) At 26 hpf, loss of ftr82 shows intersegmental vessel (ISV) growth defect (hollow arrowheads in (F)) and less or no angiogenic sprouting from the caudal vein compared to uninjected controls (arrowheads in (E) and arrows in (G)) at 30 hpf; (E,G) are enlarged figures from (C), and (F,H) are enlarged figures from (D). At 30 hpf, in uninjected control embryos, ISV has reached the dorsal longitudinal anastomotic vessel (DLAV) at the dorsal aspect of the embryo (K, arrowheads), and the CVP formed honeycomb-like structures at the tail (M, arrows). At the same stage, ISVs are stalled at mid-somite in ftr82e1i1 morphants (L, hollow arrowheads), and less honeycomb structure in the CVP (N); At 48 hpf, less or no CVP capillary loop can be observed (P) compared to the control (O, arrows); (Q) Quantification of angiogenic sprouting from the caudal vein shows a five-fold decrease in ftr82 morphants at 26 hpf (n = 29 in control; n = 26 in ftr82 MO); (R) Quantification of percentage of completed ISV shows a ~60% increase compared to ftr82 morphants (n = 32 in control and n = 28 in ftr82 MO) at 30 hpf; (S) Quantification of the deformation of CVP in ftr82 morphants by different morpholino dosage injections (1, 3 and 8 ng) shows MO in a dose-dependent manner at 48 hpf; (T,U) The efficiency of ftr82 splicing morpholino knockdown in embryos; (T) Schematic drawing showing the exon-intron structure of the ftr82 gene, the targeting area of the ftr82 splicing morpholino (ftr82e1i1 MO), and the suggested loss of the expression fragment can be detected by an ftr82mo_f and ftr82mo_r primer set; (U) cDNA from uninjected controls or 3.4 ng morpholino-injected ftr82 morphants were subjected to PCR with primers for the loading control GAPDH or for the ftr82 gene. In ftr82e1i1 morpholino-injected embryos, GAPDH levels at 283 bp are unchanged, while the amount of ftr82 product at 487 bp is diminished, indicating the loss of ftr82 expression caused by the morpholino inhibition. (*** refers to p < 0.0001 by an unpaired Student’s t-test.) Scale bars are 200 μm for A–D,I–L and 100 μm for E–H,M–P. 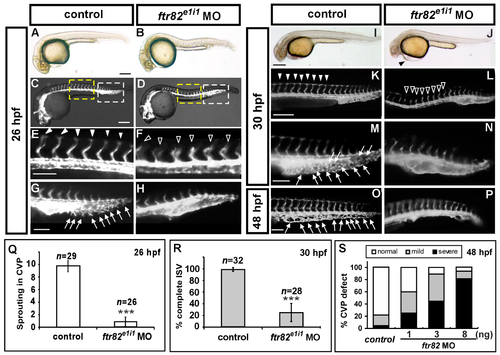
|
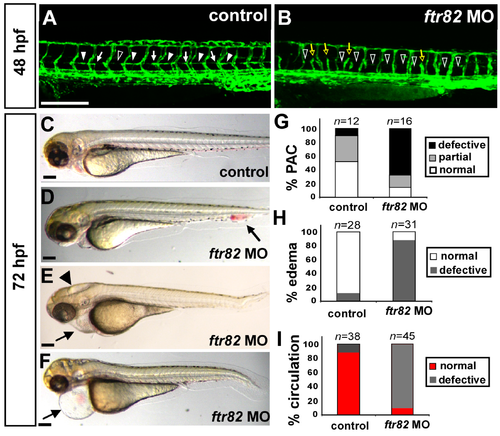
Loss of ftr82 showed edema, circulation defect, and absent parachordal chain. (A,B) At 48 hpf, ftr82 morphants showed incomplete ISV ((B), yellow hollow arrows) and absent parachordal chain (PAC) formation ((B), hollow arrowheads) compared to control (A) by using Tg (fli1a:eGFP)y1 fish; (G) Quantification of PAC formation with normal (arrowheads in (A)), partial growth (arrows in (A)) or absence (hollow arrowhead in (A)); (C–F) At 72 hpf, representative embryos showed loss of ftr82, resulting in an increasing edema in the brain (arrowhead in (E)) and pericardium (arrows in (E,F)) or blood accumulation at CVP (arrow in (D)); (H) Quantification of ftr82 morphants showed ~90% of embryos with circulation defects in the axial vessels and/or ISVs-DLAVs (n = 38 in control and n = 45 in ftr82 MO); and (I) 80% of ftr82 morphants (n = 31) with mild to severe edema and/or blood blockage compared to control (n = 28). The scale bars in (A,B) represent 200 μm and in (C–F) are 500 μm. EXPRESSION / LABELING:
PHENOTYPE:
|
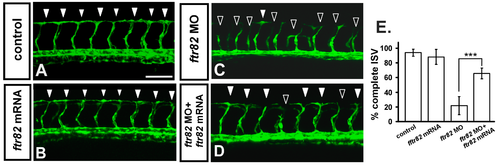
Knockdown of ftr82 can be rescued by overexpression of ftr82. In uninjected control embryos, ISV has reached the dorsal region and formed DLAV around 28–30 hpf ((A), arrowheads). At the same stage in fr82 MO, ISVs have stalled or slowed growth at mid-somite ((C), hollow arrowheads). Overexpression of ftr82 by ftr82 mRNA injection caused no obvious defect in vasculature (B), but rescued the defect of ISV stalling ((D), solid arrowheads); (E) Quantification of the percentage of completed ISV at 30 hpf shows a ~45% increase in rescued embryos compared to ftr82 morphants. Percentages of completed ISV are ~97, 22 ± 12, 92 ± 8, and 67 ± 7 in control, ftr82 MO, ftr82 mRNA overexpression, and rescued embryos, respectively. *** refers to p < 0.0001 by an unpaired Student’s t-test. Data represent means ± S.D. Scale bars are 100 μm for (A–D). |
|
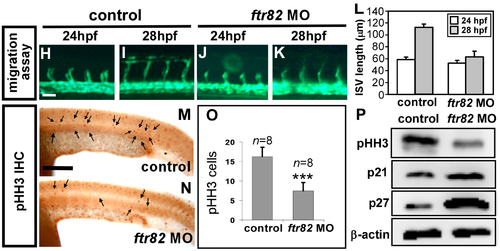
Loss of ftr82 impairs the growth of ISV cells. (A,A’,B,B’) TdT-mediated dUTP-X nick end labeling (TUNEL) assay was used to detect apoptotic cells in uninjected control and ftr82e1i1 morphants. Increased apoptotic cells were observed on the skin and in the epidermis of the dorsal tail region (arrows), but not in vascular regions in ftr82 MO compared to controls at 28 hpf; (A’,B’) are expanded images of (A) and (B), respectively; (C,D) AO staining (green dots) in Tg (kdrl:mCherry) fish exhibited more apoptotic cells with the knockdown of ftr82; (E,F) The number of cells forming each ISV counted in control Tg (kdrl:mCherryci5; fli1a:negfp y7) (E) and ftr82 morphant embryos (F) at 32 hpf; (G) Quantification of average ISV cells per ISV counted in both control (n = 16) and ftr82 morphant (n = 18); (H–L) migration assay measured the difference of ISV length from 24 to 28 hpf in control and ftr82 MO (n = 30 ISVs from three control embryos or morphants); (M,N) Proliferation marker pHH3 was counted in the trunk region beneath the neural tube and above the yolk extension area, where it is more related to main vessels and ISVs; (O) The mean number of mitotic cells (phosphohistone H3, pHH3 cells) in control was 16.3 ± 2.4 (n = 8) and in ftr82 MO was 7.5 ± 2.1 (n = 8); (P) Western blot analysis showed the reduced expression level of pHH3; the increase of p21 and p27 protein levels. β-actin serves as a loading control. Scale bars are 200 μm for (A–D,A’,B’,M,N) and 50 μm for (E,F,H–K). *** refers to p < 0.0001 by an unpaired Student’s t-test. 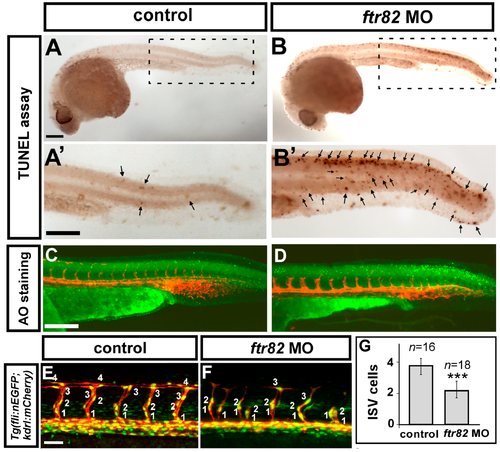
|
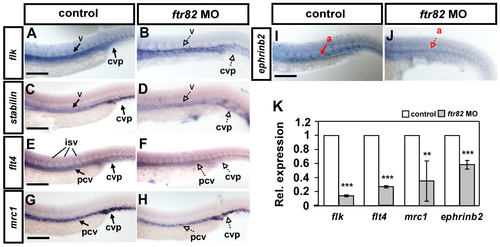
Knockdown of ftr82 affects the expression of vascular markers. Compared to uninjected controls (A,C,E,G,I), the expression of the pan-vascular markers flk and stabilin at vessels (v) and caudal vein plexus (CVP) were decreased in ftr82 morphants at 24 hpf (A–D). In addition, the expression of venous markers flt4 (E,F) and mrc1 (G,H) at posterior cardinal vein (pcv) and arterial marker ephrinb2 at aorta (a), were reduced in ftr82 morphants (I,J). (K) Quantification of the relative expression level by qPCR assay showed reduced expression in vascular markers flk (0.14 ± 0.01), flt4 (0.26 ± 0.02), mrc1 (0.35 ± 0.28), and ephrinb2 (0.58 ± 0.06) in ftr82 morphants. *** refers to p < 0.0001 and ** refers to p < 0.001 by an unpaired Student’s t-test. Data are represented as means ± S.D. Scale bars are 200 μm in A–H. |
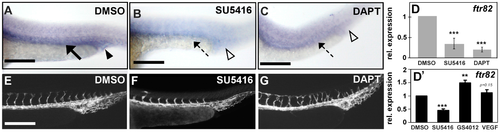
Regulation between ftr82 and VEGFR2/Notch. (A,B) ftr82 expression in vessels and CVP is reduced in VEGFR2-specific inhibitor SU5416 (10 μM)-treated embryos ((B), dashed arrow and hollow arrowhead) as compared to DMSO control embryos ((A), arrow and arrowhead); (A,C) ftr82 expression is down-regulated after treatment with Notch inactivation chemical DAPT (75 μM) ((C), dashed arrow and hollow arrowhead) as compared to DMSO control embryos (A); (D) Quantification of the relative expression level by qPCR assay showed the reduced expression of ftr82 in SU5416-treated (0.3 ± 0.18) or DAPT-treated (0.2 ± 0.1) embryos; (D’) qPCR assay showed the relative expression of ftr82 in SU5416-treated (0.5 ± 0.1), GS4012-treated (1.5 ± 0.1), or VEGF-treated (1.1 ± 0.1) embryos; (E–G) Embryos treated with 10 μM SU5416 or 75 μM DAPT showed ISV growth defects and ISV mispatterns, respectively, but vascular structure did not disappear. *** refers to p < 0.0001 and ** refers to p < 0.001 by an unpaired Student's t-test. Data are represented as means ± S.D. Scale bars represent 200 μm in (A–C,E–G). |
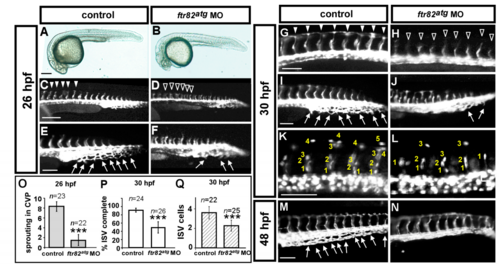
Knockdown of ftr82 causes defects in vascular development in zebrafish by using translational block ATG morpholino. (A–F) Bright-field images show the morphology of uninjected control Tg(flk:gfp) embryos (control, A) and ftr82 translational block ATG morpholino injection (ftr82atg MO) at 26 hpf (B); (C–F) Loss of ftr82 shows intersegmental vessel (ISV) growth defect (hollow arrowheads in (D)) compared to control (arrowheads in (C)), and less angiogenic sprouting from the tail caudal vein in ftr82 morphants (arrows in E,F) at 26 hours post-fertilization (hpf). (E) and (F) are enlarged figures from (C) and (D), respectively; (G–L) At 30 hpf, in uninjected control embryos, ISV have reached the dorsal longitudinal anastomotic vessel (DLAV) at the dorsal part of the embryo (G, arrowheads) and the caudal vein plexus (CVP) formed loop structures at the tail (I, arrows). Knockdown of ftr82 at the same stage showed ISVs growth stall in the middle line of somite (H, hollow arrowheads) and less honeycomb structure in the CVP (J, arrows); Reduced number of cells per ISV was photographed and counted in ftr82 morphant embryos (2.0 ± 0.5, n = 25) versus in control Tg(fli1a:negfp)y7 (3.8 ± 0.4, n = 22) (K,L,Q). At 48 hpf, less or no capillaries loop in the CVP was observed (N) compared to control (arrows in M); (O) Quantification of angiogenic sprouting from the caudal vein shows a 4.5-fold decreased in ftr82 morphants at 26 hpf (n = 23 in control and in n = 22 in ftr82 MO); (P) Quantification of percentage of completed ISV in ftr82 morphants shows a ~40% decrease (n = 24 in control and n = 26 in ftr82atg MO) at 30 hpf. *** refers to p < 0.0001 by an unpaired Student's t-test. Scale bars are 200 μm for A–D, 100 μm for E–N. |
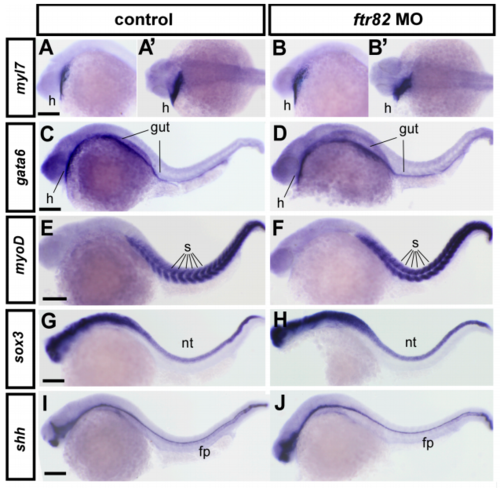
The gross developmental process is unaffected in ftr82 morphants. Knockdown of ftr82 at 24 hpf did not alter the expression pattern of heart, gut, somite, or neural systems by examining the expression of myl7 (heart marker, h, A and B are lateral view and A’ and B’ are dorsal view), gata6 (heart and gut marker, C,D), myoD (somite marker, s, E,F), and sox3 (neural tube marker, nt, G,H) and shh (floor plate marker, fp, I,J). Scale bars in all figures are 250 μm. EXPRESSION / LABELING:
|