
- Title
-
Pharmacological and BBB-targeted genetic therapies for thyroid hormone-dependent hypomyelination
- Authors
- Zada, D., Tovin, A., Lerer-Goldshtein, T., Appelbaum, L.
- Source
- Full text @ Dis. Model. Mech.

ZFIN is incorporating published figure images and captions as part of an ongoing project. Figures from some publications have not yet been curated, or are not available for display because of copyright restrictions. EXPRESSION / LABELING:
PHENOTYPE:
|
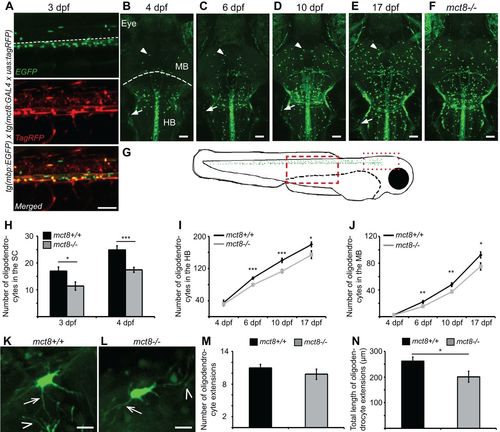
Hypomyelination in the brain and spinal cord (SC) of mct8−/− larvae during development. (A) Lateral view of the trunk in 3-dpf tg(mbp:EGFP) x tg(mct8:GAL4 x uas:tagRFP) embryo revealed colocalization of mct8-promoter-driven signal (red, middle panel) in oligodendrocytes (green, top panel) of the SC. Dashed white line in the top picture marks the boundary between the dorsal and ventral SC. (B-F) Dorsal view of the hindbrain (HB) and midbrain (MB; dashed white line marks the boundary between the MB and HB) of 4 (B), 6 (C), 10 (D) and 17 (E)-dpf tg(mbp:EGFP) larvae, as well as 17-dpf tg(mbp:EGFP)/mct8−/− larvae (F). Arrows and arrowheads indicate Schwann cells and oligodendrocytes, respectively. (G) Illustration of the tg(mbp:EGFP) larvae. Distribution of oligodendrocyte in the CNS is marked with green spots. Dashed and dotted boxes represent the imaged areas in the SC and brain, respectively, as shown in A-F. (H) Number of oligodendrocytes in the dorsal SC of 3 (mct8+/+: n=23, mct8−/−: n=23)- and 4 (mct8+/+: n=19, mct8−/−: n=21)-dpf larvae. (I) Number of oligodendrocytes counted in the HB of 4 (mct8+/+: n=7, mct8−/−: n=14)-, 6 (mct8+/+: n=33, mct8−/−: n=39)-, 10 (mct8+/+: n=17, mct8−/−: n=18)- and 17 (mct8+/+: n=14, mct8−/−: n=12)-dpf larvae. (J) Number of oligodendrocytes counted in the MB of 4 (mct8+/+: n=8, mct8−/−: n=8)-, 6 (mct8+/+: n=25, mct8−/−: n=30)-, 10 (mct8+/+: n=17, mct8−/−: n=18)- and 17 (mct8+/+: n=13, mct8−/−: n=13)-dpf larvae. (K,L) Imaging of single oligodendrocytes in the MB of mct8+/+ (K) and mct8−/− (L) 10-dpf larvae. Arrows and arrowheads indicate self and neighboring oligodendrocyte extensions, respectively. (M) The number of oligodendrocyte extensions per single cell (mct8+/+: n=29 cells, mct8−/−: n=24 cells). (M) Total length of oligodendrocyte extensions per single cell (mct8+/+: n=29 cells, mct8−/−: n=24 cells). Scale bars: 50 µm (A-F), 10 µm (K,L). Values are represented as means±s.e.m. Statistical significance was determined by Student's t-test: two samples assuming unequal variance (*P<0.05, **P<0.01, ***P<0.001). EXPRESSION / LABELING:
PHENOTYPE:
|
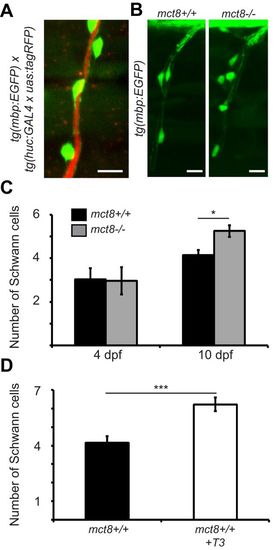
Increased number of Schwann cells in mct8−/− larvae during development. (A) Lateral view of a motor neuron in 10-dpf live tg(mbp:EGFP)/tg(huc:GAL4 x uas:tagRFP) larvae shows Schwann cell (green) ensheathment of motor neuron axons (red). (B) Representative lateral-view images of Schwann cell ensheathment of motor neuron axons in the SC of 10-dpf mct8+/+ and mct8−/− larvae. (C) Number of Schwann cells that myelinate the axons of the motor neurons of 4 (mct8+/+: n=9, mct8−/−: n=9)- and 10 (mct8+/+: n=26, mct8−/−: n=22)-dpf larvae. (D) Number of Schwann cells that myelinate the axons of the motor neurons of untreated and T3-treated mct8+/+ 10-dpf larvae (untreated: n=26, T3-treated: n=19). Values are represented as means±s.e.m. Statistical significance was determined by Student's t-test: two samples assuming unequal variance (*P<0.05, ***P<0.001). Scale bars: 10 µm. |
|
ZFIN is incorporating published figure images and captions as part of an ongoing project. Figures from some publications have not yet been curated, or are not available for display because of copyright restrictions. PHENOTYPE:
|
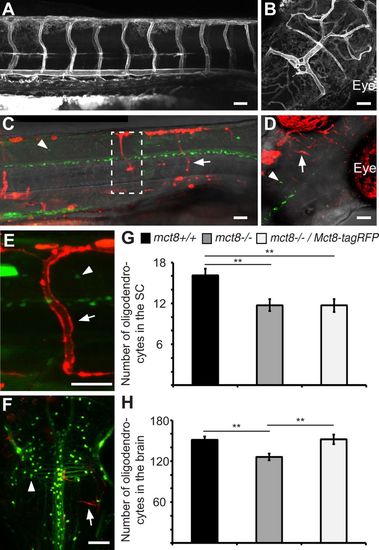
Specific expression of Mct8 in the vascular system and BBB rescues the number of oligodendrocytes in the brain. (A,B) Lateral view of the trunk (A, head pointing to the right) and dorsal view of the head (B) of a tg(fli:Mct8-EGFP) 3-dpf embryo. (C-F) Lateral view of the trunk (C,E, head pointing to the right) and dorsal view of the head (D,F) of a tg(mbp:EGFP) larvae injected with fli:Mct8-tagRFP. Arrows indicate the expression of Mct8-tagRFP in the endothelial cells of the vascular system, and arrowheads indicate oligodendrocytes in the CNS. Wide (C) and high-magnification (dashed box in C, E) views in 3-dpf larvae show red mosaic expression of Mct8-tagRFP and green oligodendrocytes. Dorsal view of the head shows green oligodendrocytes in the brain and mosaic expression of Mct8-tagRFP in 3 (D)- and 10 (F)-dpf larvae. (G) Number of oligodendrocytes counted in the spinal cord (SC) of 3-dpf larvae (mct8+/+: n=37, mct8−/−: n=42 and mct8−/−/Mct8-tagRFP: n=26, **P<0.01). (H) Number of oligodendrocytes counted in the brain of 10-dpf larvae (mct8+/+: n=10, mct8−/−: n=10 and mct8−/−/Mct8-tagRFP: n=11, **P<0.01). Values represented as means±s.e.m. Statistical significance determined by one-way ANOVA followed by post-hoc Tukey HSD test (**P<0.01). Scale bars: 50 µm. EXPRESSION / LABELING:
PHENOTYPE:
|