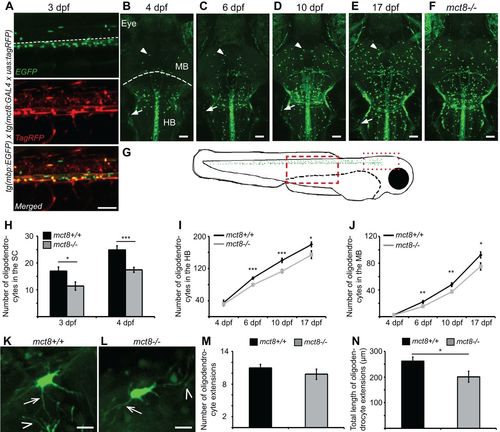
Hypomyelination in the brain and spinal cord (SC) of mct8−/− larvae during development. (A) Lateral view of the trunk in 3-dpf tg(mbp:EGFP) x tg(mct8:GAL4 x uas:tagRFP) embryo revealed colocalization of mct8-promoter-driven signal (red, middle panel) in oligodendrocytes (green, top panel) of the SC. Dashed white line in the top picture marks the boundary between the dorsal and ventral SC. (B-F) Dorsal view of the hindbrain (HB) and midbrain (MB; dashed white line marks the boundary between the MB and HB) of 4 (B), 6 (C), 10 (D) and 17 (E)-dpf tg(mbp:EGFP) larvae, as well as 17-dpf tg(mbp:EGFP)/mct8−/− larvae (F). Arrows and arrowheads indicate Schwann cells and oligodendrocytes, respectively. (G) Illustration of the tg(mbp:EGFP) larvae. Distribution of oligodendrocyte in the CNS is marked with green spots. Dashed and dotted boxes represent the imaged areas in the SC and brain, respectively, as shown in A-F. (H) Number of oligodendrocytes in the dorsal SC of 3 (mct8+/+: n=23, mct8−/−: n=23)- and 4 (mct8+/+: n=19, mct8−/−: n=21)-dpf larvae. (I) Number of oligodendrocytes counted in the HB of 4 (mct8+/+: n=7, mct8−/−: n=14)-, 6 (mct8+/+: n=33, mct8−/−: n=39)-, 10 (mct8+/+: n=17, mct8−/−: n=18)- and 17 (mct8+/+: n=14, mct8−/−: n=12)-dpf larvae. (J) Number of oligodendrocytes counted in the MB of 4 (mct8+/+: n=8, mct8−/−: n=8)-, 6 (mct8+/+: n=25, mct8−/−: n=30)-, 10 (mct8+/+: n=17, mct8−/−: n=18)- and 17 (mct8+/+: n=13, mct8−/−: n=13)-dpf larvae. (K,L) Imaging of single oligodendrocytes in the MB of mct8+/+ (K) and mct8−/− (L) 10-dpf larvae. Arrows and arrowheads indicate self and neighboring oligodendrocyte extensions, respectively. (M) The number of oligodendrocyte extensions per single cell (mct8+/+: n=29 cells, mct8−/−: n=24 cells). (M) Total length of oligodendrocyte extensions per single cell (mct8+/+: n=29 cells, mct8−/−: n=24 cells). Scale bars: 50 µm (A-F), 10 µm (K,L). Values are represented as means±s.e.m. Statistical significance was determined by Student's t-test: two samples assuming unequal variance (*P<0.05, **P<0.01, ***P<0.001).
|
