
- Title
-
Mismatch of Synaptic Patterns between Neurons Produced in Regeneration and during Development of the Vertebrate Retina
- Authors
- D'Orazi, F.D., Zhao, X.F., Wong, R.O., Yoshimatsu, T.
- Source
- Full text @ Curr. Biol.
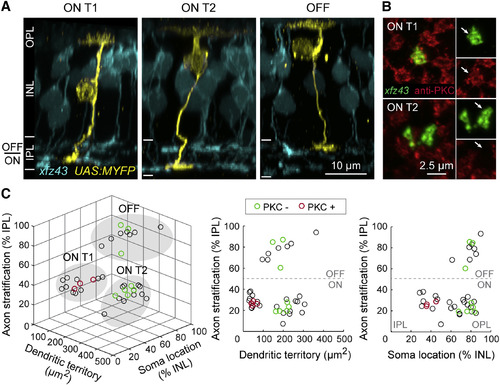
Morphology and Classification of Three xfz43 BC Types in Larval Zebrafish Retina (A) Maximum-intensity projections of confocal image stacks of individual xfz43 BCs (yellow) together with the xfz43 BC population (cyan) in 20 dpf tissue. Individual cells were visualized by transient fluorescent protein (FP) expression in xfz43 transgenic fish (see Experimental Procedures). The dendrites of BCs target the outer plexiform layer (OPL) while their axons project to the inner plexiform layer (IPL), and BC nuclei reside in the inner nuclear layer (INL). ON type 1 (ON T1) and ON type 2 (ON T2) populations stratify their axon terminals in the inner half of the IPL (ON), whereas a third population stratifies in the outer half (OFF). (B) En face views of ON T1 and T2 BC axon terminals with antibody labeling against PKC. Arrows mark the BC axon terminal. (C) Scatterplots show population data for the morphology and PKC expression of individually labeled cells (see Experimental Procedures and Figure S1 for details on morphological analyses). Each open circle represents a single cell, n = 39 cells. Cells that were analyzed for PKC expression are green (PKC-negative) or red (PKC-positive). Filled, gray ovals depict the groups by which cells were classified as ON T1, ON T2, or OFF types using the K-means clustering algorithm. All measurements were made in 20 dpf xfz43 larvae. See also Figure S1 and Table S1. |
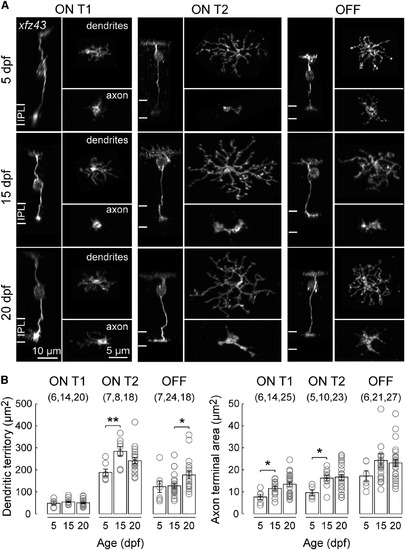
The Neurites of xfz43 BCs Grow without Remodeling during Maturation (A) Representative ON T1, ON T2, and OFF xfz43 BCs visualized in fixed retinal tissue at 5, 15, and 20 dpf. BCs were classified based on a combination of dendritic territory and axon stratification measures. Side views of whole BCs, en face views of dendritic arbors and axon terminals. (B) Plots across ages of the mean dendritic territory sizes and axon terminal areas for each xfz43 BC type. Each open circle represents one cell, with the number of cells analyzed in parentheses. Error bars, ±SEM. *p < 0.05, **p < 0.01; Wilcoxon-Mann-Whitney rank-sum test. |
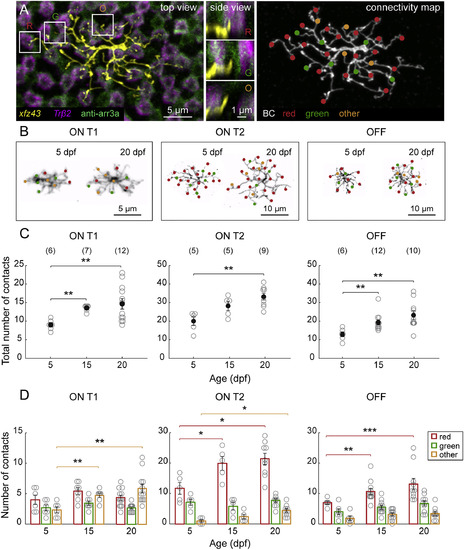
xfz43 BCs Generate Type-Specific Connectivity Patterns over Time by Preferential Synaptogenesis (A) An individual ON T2 BC labeled by transient FP expression in a 20 dpf xfz43 transgenic fish crossed with Tg(Trβ2:Tomato). Trβ2, red cones; anti-arr3a, red and green cones. Dendritic invaginations into red cones (R) and green cones (G), as well as dendritic tips not associated with red or green cones, “others” (O), are evident at the level of the cone axon terminals (top view), and in vertical views of the boxed areas (side view). Filled circles map the locations of dendritic tips that contacted red or green cones, or others. (B) Representative connectivity maps of each xfz43 BC type from 5 to 20 dpf. (C) Population data showing the mean, total number of invaginating dendritic tips per BC type from 5 to 20 dpf. (D) Quantification of the mean number of contacts per cone type across ages. Open circles represent values from individual cells, with the number of cells analyzed shown in parentheses. Error bars, ±SEM. *p < 0.05, **p < 0.01, ***p < 0.001; Wilcoxon-Mann-Whitney rank-sum test. See also Figures S2 and S3 and Movie S1. |
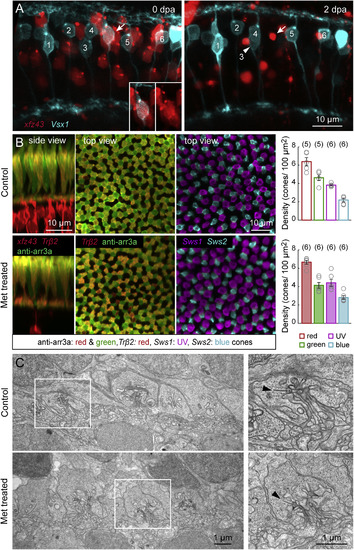
Nitroreductase-Induced Ablation of xfz43 BCs Does Not Damage Neighboring Cells (A) Multiphoton time-lapse imaging of xfz43 BCs in the background of Tg(Vsx1:MCerulean) before and after cell ablation at 7 dpf. Larvae were imaged immediately prior to Met immersion, at 0 days post ablation (dpa), and after treatment, at 2 dpa. Vsx1 labels a population of BCs that includes a subset of xfz43 OFF BCs (arrow, inset). The somata of one of the Vsx1 BCs translocated between imaging sessions (arrowhead). (B) Ablation of xfz43 BCs in the background of transgenically or immunostained cones. Red and green cones were visualized in xfz43 fish crossed with Tg(Trβ2:Tomato) larvae together with anti-arrestin3a immunostaining. UV and blue cones were visualized in xfz43 larvae crossed with Tg(Sws1:GFP; Sws2:mCherry). Maximum-intensity projections of confocal image stacks from 12 dpf (5 dpa) control or Met-treated retinas. Plots show the mean cell density of each cone type from Met-treated larvae at 5 dpa, and from age-matched control animals. Each open circle represents a single retina, with the number of retinas analyzed shown in parentheses. Error bars, ±SEM. Pairwise comparisons of the densities of each cone population between conditions showed no significant differences (p > 0.05, Wilcoxon-Mann-Whitney rank-sum test). (C) Electron micrograph of the OPL in control and Met-treated retinas from 12 dpf xfz43 larvae. Insets show the ribbon synapses of single cone axon terminals. Arrowheads mark presynaptic ribbons. |
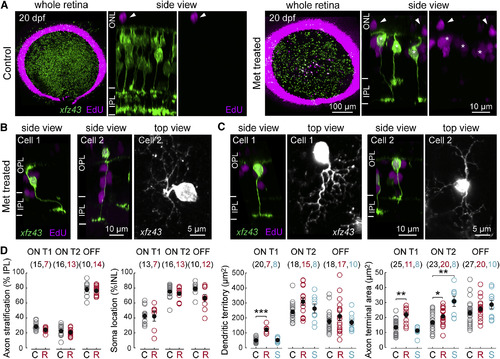
Regenerated xfz43 BCs Resemble Age-Matched BCs from Intact Tissue (A) Maximum-intensity projections of whole-mount retinas from 20 dpf (13 dpa) control and Met-treated xfz43 fish in which mitotic cells were labeled by EdU application from 9 to 12 dpf (2-5 dpa). The dense ring of EdU-positive cells at the peripheral retina demarcates cells generated in the ciliary marginal zone, a region of ongoing proliferation [4]. Asterisks in side views mark xfz43 BCs that incorporated EdU; arrowheads mark EdU-positive cells in the outer nuclear layer (ONL). (B) Examples of regenerated xfz43 BCs with abnormal axon trajectories (cell 1), or mislocalized somata (cell 2). <>(C) Examples of regenerated xfz43 BCs with abnormal dendritic phenotypes; cell 1 has an asymmetric arbor relative to the cell body, cell 2 shows an unusually sparse dendritic arbor. In (B) and (C), side views are orthogonal rotations of the image stack acquired from the whole-mount retina. Top views are the maximum-intensity projections of the cell somata and their dendrites tilted slightly relative to the z axis of the image stack, in order to illustrate the dendritic arbor, the primary dendrite, and the cell body, where possible.(D) Quantification of regenerated (R, red) and survivor (S, cyan) xfz43 BC morphology. Cell types were classified using a combination of at least two morphological features: whether the BC stratified in ON or OFF IPL layers, dendritic territory size, and/or PKC expression. Plots show the population mean compared with control (C, gray) data. Open circles represent individual cells, with the number of cells analyzed shown in parentheses. Error bars, ±SEM. *p < 0.05, **p < 0.01, ***p < 0.001; Wilcoxon-Mann-Whitney rank-sum test. All measurements were made in 20 dpf (13 dpa) larvae. See also Figures S1, S4, and S5. |
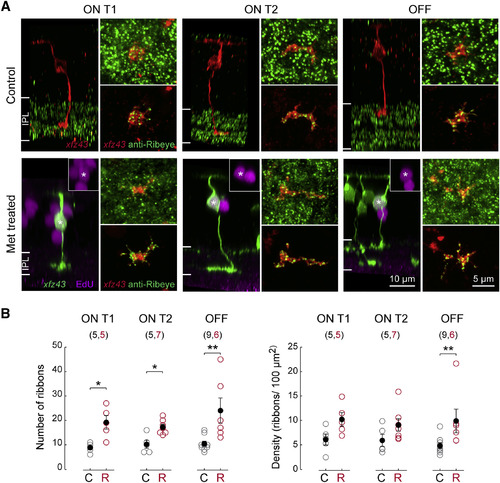
Regenerated BCs Form Excess Ribbon Synapses in the IPL (A) Examples of individual ON T1, ON T2, and OFF BCs visualized together with Ribeye A immunolabeling in fixed tissue from control or Met-treated larvae at 20 dpf (13 dpa). The Ribeye A antibody produced the expected staining pattern, showing punctate labeling within the IPL. Individual BCs in control tissue were visualized by DNA plasmid injection. Regenerated BCs in Met-treated tissue were identified by NTR-mCherry expression and EdU incorporation. En face views of axon terminal synapses labeled with anti-Ribeye A. A volumetric mask of the xfz43 FP signal was used for visualization of ribbon synapses within an BC individual terminal (bottom panel). (B) Comparisons of the mean number and density of Ribeye A puncta on xfz43 BC axon terminals of regenerated (R, red) BCs with counts from BCs in control (C, gray) tissue. Open circles represent individual cells, with the number of cells analyzed shown in parentheses. Error bars, ±SEM. *p < 0.05, **p < 0.01; Wilcoxon-Mann-Whitney rank-sum test. All measurements were made in 20 dpf (13 dpa) larvae. |
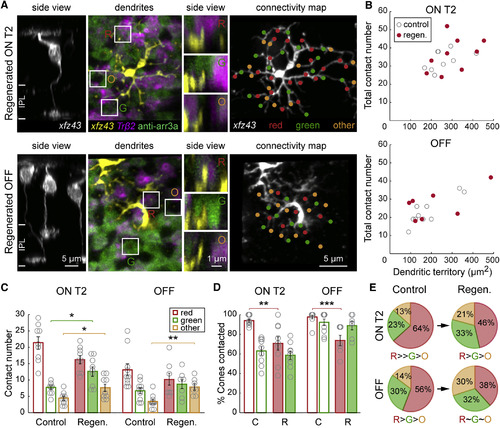
Regenerated ON T2 and OFF xfz43 BCs Do Not Maintain Their Stereotypic Synapse Distributions among Preferred Partners (A) Regenerated ON T2 and OFF xfz43 BCs, as identified by EdU incorporation, together with red and green cones in xfz43 fish crossed with Tg(Tr²2:MA-YFP). Vertical views of the boxed areas show dendritic invaginations into red cones (R) and green cones (G), as well as dendritic tips not associated with red or green cones, “others” (O). (B) Total contact number versus dendritic territory size of regenerated (regen., red) or age-matched control (gray) ON T2 or OFF cells. The total contact densities of regenerated cells did not differ from those of control populations (ON T2: p > 0.05; regenerated OFF: p > 0.05; Wilcoxon-Mann-Whitney rank-sum test). (C) Comparisons of the mean number of contacts made per cone type between regenerated and control xfz43 BCs of the same type. *p < 0.05, **p < 0.01; Wilcoxon-Mann-Whitney rank-sum test. (D) Quantification of the proportion of available cones of each type that ON T2 and OFF BCs contacted in control (C) and regenerated retinas (R). **p < 0.01, ***p < 0.001; chi-square test. (E) Pie charts show the mean proportion of the total contact number that was made with red cones, green cones, or other photoreceptors for control and regenerated BC populations. The contact distributions of regenerated cells of both types differed from those of control populations (ON T2: p < 0.0001; OFF: p = 0.0002, chi-square test). Regenerated ON T2 BCs still made a higher proportion of contacts with red cones compared to green cones (p = 0.02, chi-square test), and a higher proportion of contacts with green cones compared to others (p = 0.002, chi-square test). The distribution of contacts among distinct partner types did not significantly differ for regenerated OFF BCs (p > 0.05, chi-square test). Open circles represent individual cells, with the number of cells analyzed shown in parentheses. Error bars, ±SEM. All measurements were made in 20 dpf (13 dpa) larvae. See also Movie S1. |
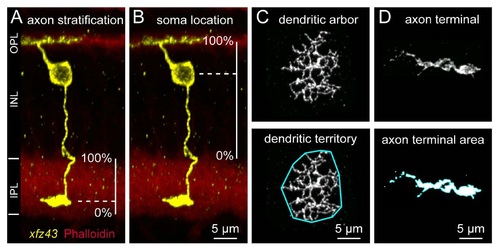
Related to Figures 1 and S. Quantitative Analysis of Be Morphology. (A) The stratification levels of Be axons were analyzed by measuring the distance of the axon terminal from the inner (0% IPL width) to outer IPL (100% IPL width) , and normalizing to the total width of the IPL. The IPL was visualized by an actin or nuclear stain. (B) The locations of Be somata within the INL were assessed by measuring the distance from the center of the soma to the OPL, and normalizing to the total width of the INL. The INL width was judged as the distance from the outer boundary of the IPL (0% INL width) to the OPL (100% INL width). (C) The sizes of Be dendritic territories were analyzed by visualizing a maximum intensity projection of the dendritic arbor en face, drawing a boundary around the outermost dendritic tips, and measuring the area within the resulting polygon (shown outlined in cyan). (D) Be axon terminal size was quantified as the area of the axon terminal in a thresholded maximum intensity projection. This was achieved by converting the image fluorescence into a binary mask, and measuring the masked area that corresponded to the individual axon terminal (shown outlined in cyan). |
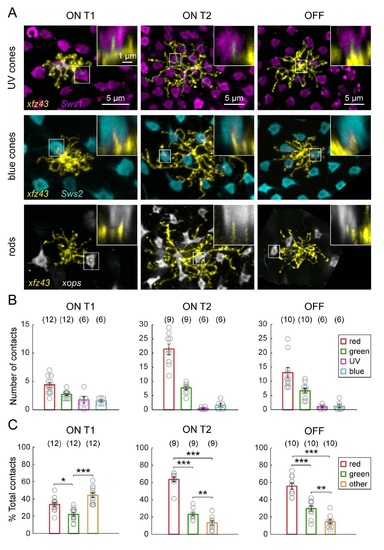
Related to Figure 3. xJz43 BC Types Contact Non-Red and Green Photoreceptor Types to Varying Degrees. (A) xJz43 BCs can contact UV cones, blue cones, and rods . Images show maximum intensity projections of the dendritic arbors of individual BCs visualized in the xJz43 fish in the background of labeled UV cones Tg(Swsl:GFP), blue cones Tg(Sws2:GFP) , or rod photoreceptors Tg(xops:GFP) at 15 or 20 dpf. Insets are vertical views showing invaginating dendritic tips . (B) Quantification of the mean number of cone photoreceptors of each type that were contacted. Data is pooled from fish in which red, green, UV and blue cones were labeled together, only UV and blue cones were labeled together, or only red and green cones were labeled. (C) Plots show the mean proportion of contacts made with red, green, or other cone types, relative to the total number of contacts. Each open circle represents a single cell, with the number of cells analyzed shown in parentheses. Error bars are ± SEM. * P < 0.05, ** P < 0.01, *** P < 0.001 Chi-square test. All measurements were made in 20 dpf xJz43 larvae. |
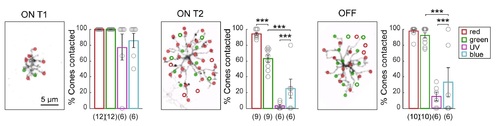
Related to Figure 3. Differences in BC Wiring with Preferred Partners to Generate Biased Connectivity. Plots show the percentage of cones contacted relative to the number of available cones of each type (% cones contacted). Open circles represent individual cells, with the number of cells analyzed shown in parentheses. Error bars are ± SEM. *** P < 0.0001, Chi-square test. Connectivity maps demonstrate the method used for quantifying the number of "available" cones of each cone type, with only red and green cones shown. In the maps, filled circles mark the locations of cone contacts, open circles denote the center of mass of cone terminals within the BC dendritic territory that were not contacted. |
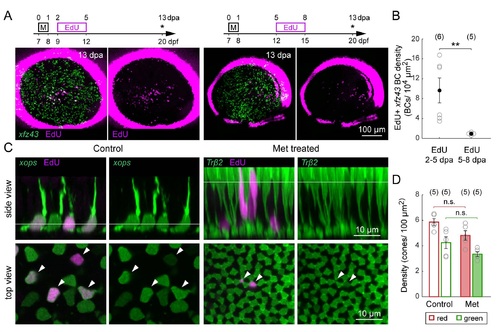
Related to Figure S. Proliferation of Retinal Neurons after Targeted Ablation of BCs. (A) Peak proliferation occurs within 2-5 dpa. Timelines demonstrate the timing of EdU immersion after Met (M) application in two different groups: 2-5 or 5-8 dpa. Asterisks denote age at which larvae were fixed for imaging. Maximum intensity projections of wholemount retinas from 13 dpa Met-treated xJz43 fish that were immersed in EdU. (B) Comparison of the mean density of EdU-positive xJz43 BCs between larvae treated with EdU from 2-5 or 5-8 dpa. ** P < 0.01, Wilcoxon-Mann-Whitney rank sum test. (C) Photoreceptor genesis in the ONL of control and Met-treated xJz43 larvae. (Side view) Orthogonal views of confocal image stacks from control and Met-treated xJz43 animals, with co-labeling for EdU together with rods Tg(xops:GFP) or red cones Tg(Trfβ2:Tomato) . (Top view) En Jace view of the photoreceptors and EdU-labeled nuclei at the levels indicated in the side views. Arrowheads mark EdU-positive nuclei. (D) Quantification of the mean cell density of red or green cones in retinas from Met-treated and age-matched control xJz43 fish crossed with Tg(Trfβ2 :Tomato) and immunostained with anti-arrestin3a. Pair-wise comparisons showed that cone densities did not differ between control and Met-treated retinas (red cone density: P > 0.05, green cone density: P > 0.05 , Wilcoxon-Mann-Whitney rank sum test) . Each open circle represents a single retina, with the number of retinas analyzed shown in parentheses. Error bars are ± SEM. All measurements were made in 20 dpf (13 dpa) xJz43 larvae. |
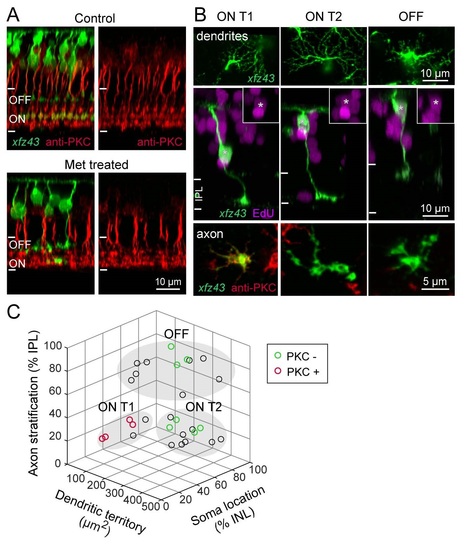
Related to Figure S. Regenerated BCs Recover Characteristic Molecular Expression and Morphology. (A) PKC-positive BCs stratify in ON layers of IPL in the retinas of control and Met-treated xJz43 fish . Orthogonal views from maximum intensity projections of xJz43 BCs together with anti-PKC labeling in 20 dpf control or Met-treated xJz43 larvae. (B) Regenerated xJz43 BCs show type-specific PKC expression . Maximum intensity projections from confocal image stacks of regenerated xJz43 BCs from 20 dpf tissue. Asterisks mark EdU-positive BC nuclei, also shown in insets. EnJace views show dendritic arbors, or axonal arbors together with PKC immunolabeling. (C) Regenerated xJz43 BCs cluster in characteristic groups by morphological measurements. 3D scatter plot of population data for regenerated xJz43 BCs from 20 dpf Met-treated retinas. Each circle represents a single cell, n = 29 cells. Cells that were analyzed for PKC expression are green (PKC-negative) or red (PKC-positive). Filled, gray ovals depict the groups by which cells were classified as ON Tl, ON T2, or OFF types using the K-means clustering algorithm. |