
|
Fig. 3
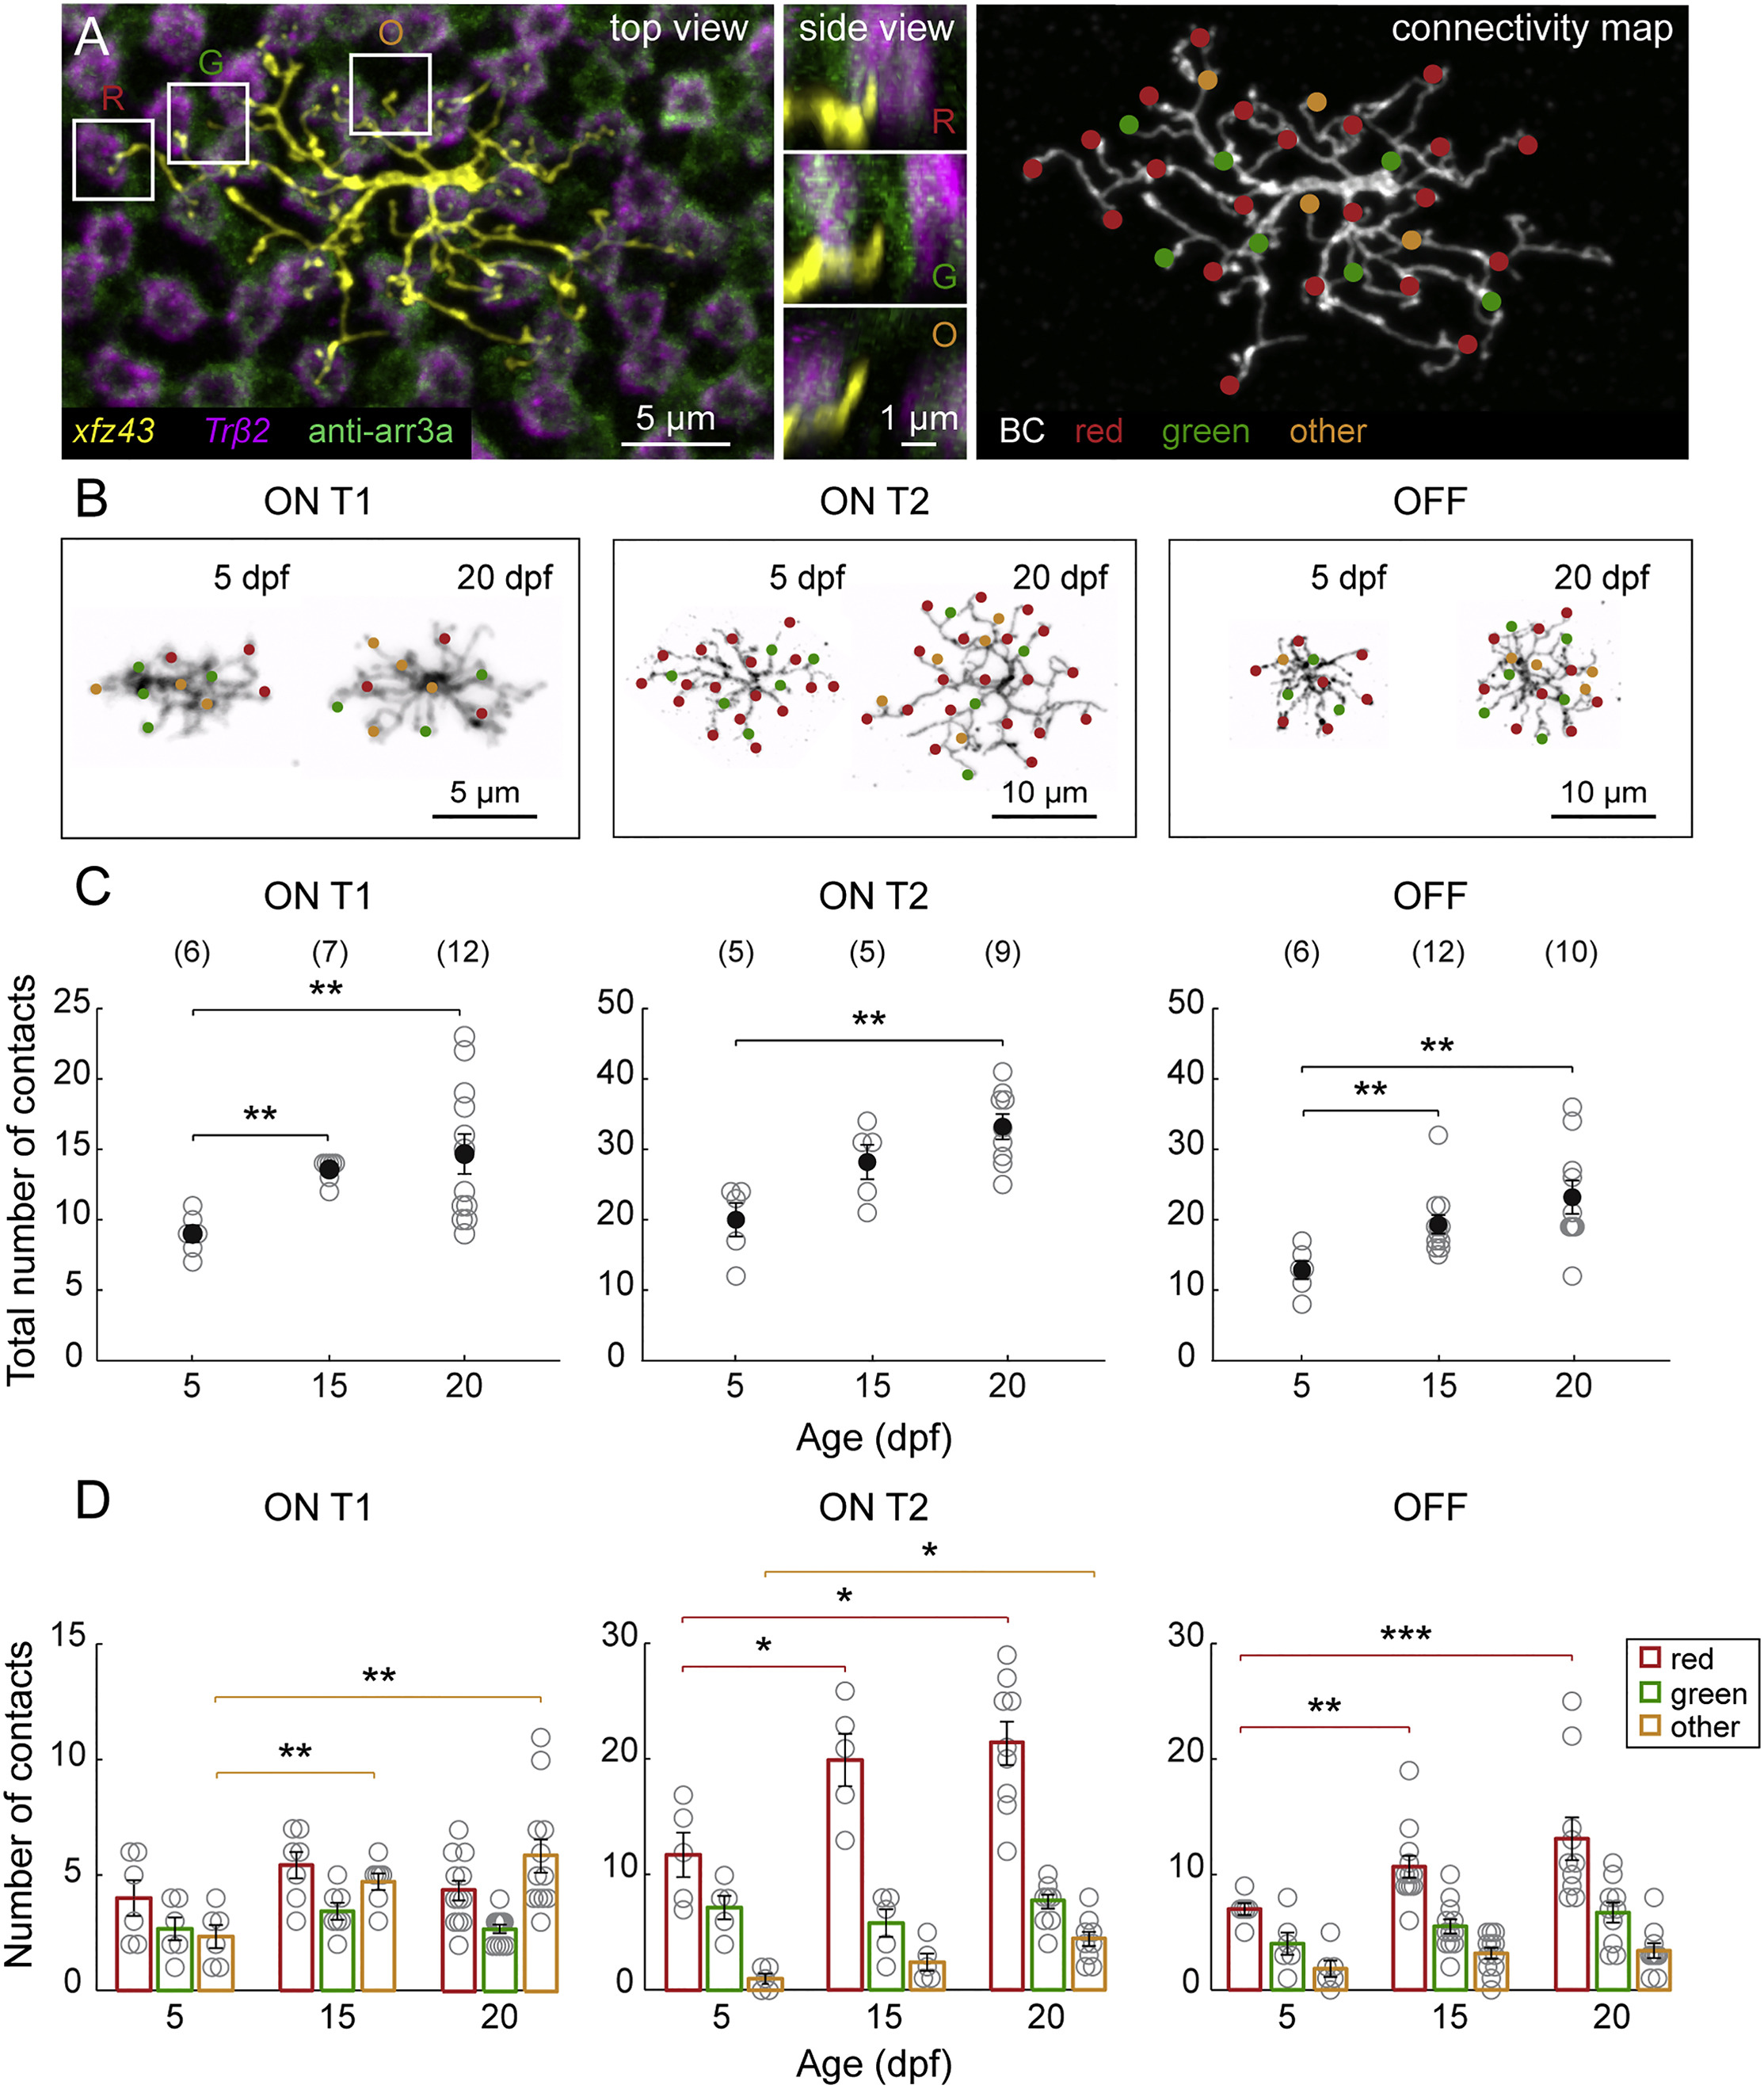
xfz43 BCs Generate Type-Specific Connectivity Patterns over Time by Preferential Synaptogenesis
(A) An individual ON T2 BC labeled by transient FP expression in a 20 dpf xfz43 transgenic fish crossed with Tg(Trβ2:Tomato). Trβ2, red cones; anti-arr3a, red and green cones. Dendritic invaginations into red cones (R) and green cones (G), as well as dendritic tips not associated with red or green cones, “others” (O), are evident at the level of the cone axon terminals (top view), and in vertical views of the boxed areas (side view). Filled circles map the locations of dendritic tips that contacted red or green cones, or others.
(B) Representative connectivity maps of each xfz43 BC type from 5 to 20 dpf.
(C) Population data showing the mean, total number of invaginating dendritic tips per BC type from 5 to 20 dpf.
(D) Quantification of the mean number of contacts per cone type across ages.
Open circles represent values from individual cells, with the number of cells analyzed shown in parentheses. Error bars, ±SEM. *p < 0.05, **p < 0.01, ***p < 0.001; Wilcoxon-Mann-Whitney rank-sum test. See also Figures S2 and S3 and Movie S1.