
Fig. 7
- ID
- ZDB-FIG-161018-15
- Publication
- D'Orazi et al., 2016 - Mismatch of Synaptic Patterns between Neurons Produced in Regeneration and during Development of the Vertebrate Retina
- Other Figures
- All Figure Page
- Back to All Figure Page
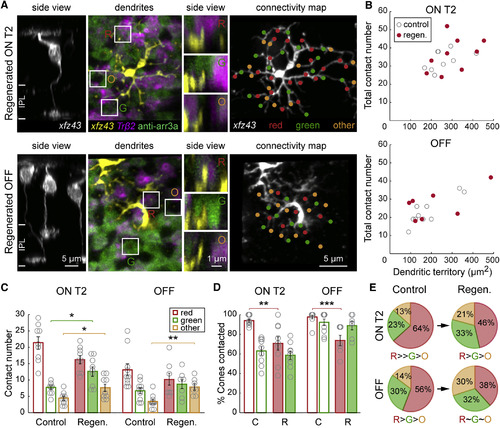
Regenerated ON T2 and OFF xfz43 BCs Do Not Maintain Their Stereotypic Synapse Distributions among Preferred Partners (A) Regenerated ON T2 and OFF xfz43 BCs, as identified by EdU incorporation, together with red and green cones in xfz43 fish crossed with Tg(Tr²2:MA-YFP). Vertical views of the boxed areas show dendritic invaginations into red cones (R) and green cones (G), as well as dendritic tips not associated with red or green cones, “others” (O). (B) Total contact number versus dendritic territory size of regenerated (regen., red) or age-matched control (gray) ON T2 or OFF cells. The total contact densities of regenerated cells did not differ from those of control populations (ON T2: p > 0.05; regenerated OFF: p > 0.05; Wilcoxon-Mann-Whitney rank-sum test). (C) Comparisons of the mean number of contacts made per cone type between regenerated and control xfz43 BCs of the same type. *p < 0.05, **p < 0.01; Wilcoxon-Mann-Whitney rank-sum test. (D) Quantification of the proportion of available cones of each type that ON T2 and OFF BCs contacted in control (C) and regenerated retinas (R). **p < 0.01, ***p < 0.001; chi-square test. (E) Pie charts show the mean proportion of the total contact number that was made with red cones, green cones, or other photoreceptors for control and regenerated BC populations. The contact distributions of regenerated cells of both types differed from those of control populations (ON T2: p < 0.0001; OFF: p = 0.0002, chi-square test). Regenerated ON T2 BCs still made a higher proportion of contacts with red cones compared to green cones (p = 0.02, chi-square test), and a higher proportion of contacts with green cones compared to others (p = 0.002, chi-square test). The distribution of contacts among distinct partner types did not significantly differ for regenerated OFF BCs (p > 0.05, chi-square test). Open circles represent individual cells, with the number of cells analyzed shown in parentheses. Error bars, ±SEM. All measurements were made in 20 dpf (13 dpa) larvae. See also Movie S1. |