
Fig. 1
- ID
- ZDB-FIG-161018-9
- Publication
- D'Orazi et al., 2016 - Mismatch of Synaptic Patterns between Neurons Produced in Regeneration and during Development of the Vertebrate Retina
- Other Figures
- All Figure Page
- Back to All Figure Page
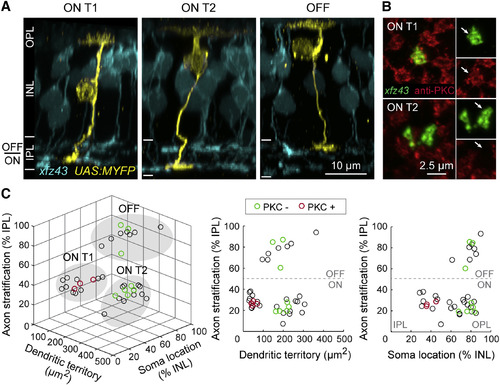
Morphology and Classification of Three xfz43 BC Types in Larval Zebrafish Retina (A) Maximum-intensity projections of confocal image stacks of individual xfz43 BCs (yellow) together with the xfz43 BC population (cyan) in 20 dpf tissue. Individual cells were visualized by transient fluorescent protein (FP) expression in xfz43 transgenic fish (see Experimental Procedures). The dendrites of BCs target the outer plexiform layer (OPL) while their axons project to the inner plexiform layer (IPL), and BC nuclei reside in the inner nuclear layer (INL). ON type 1 (ON T1) and ON type 2 (ON T2) populations stratify their axon terminals in the inner half of the IPL (ON), whereas a third population stratifies in the outer half (OFF). (B) En face views of ON T1 and T2 BC axon terminals with antibody labeling against PKC. Arrows mark the BC axon terminal. (C) Scatterplots show population data for the morphology and PKC expression of individually labeled cells (see Experimental Procedures and Figure S1 for details on morphological analyses). Each open circle represents a single cell, n = 39 cells. Cells that were analyzed for PKC expression are green (PKC-negative) or red (PKC-positive). Filled, gray ovals depict the groups by which cells were classified as ON T1, ON T2, or OFF types using the K-means clustering algorithm. All measurements were made in 20 dpf xfz43 larvae. See also Figure S1 and Table S1. |