
- Title
-
Neuromodulatory Regulation of Behavioral Individuality in Zebrafish
- Authors
- Pantoja, C., Hoagland, A., Carroll, E.C., Karalis, V., Conner, A., Isacoff, E.Y.
- Source
- Full text @ Neuron
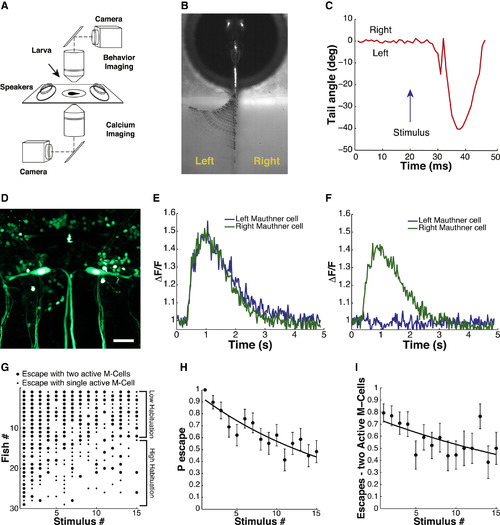
Simultaneous Analysis of Escape Behavior and M-Cell Calcium Signals during ASR Habituation in 6 dpf Zebrafish Larvae (A) Simultaneous behavior (2.5× objective, 1,000 fps) and GCaMP5 calcium imaging of M-cells (40× objective, 40 fps) with two independent light paths. (B) Representative image of time-series projection (ventral view) of sound-induced escape behavior. (C) Tracking of tail movement during response to acoustic stimulus at t = 20 ms. (D) Representative image (dorsal view) of tg(s1181t:Gal4;UAS:kaede) transgenic zebrafish line. Scale bar, 25 µm. (E and F) GCaMP5 calcium activity traces from M-cells in response to acoustic stimulus at 400 ms. (G) Acoustic startle responses of individual larvae ordered along y axis by probability of escape over the stimulus series. Each dot represents a sound-induced escape event: large dot represents escape with two M-cells active; small dot represents escape with one M-cell active. (H) Decrease in ASR probability during stimulus series (F-statistic versus constant model: 41.5, p < 10-9, adjusted R-squared = 0.085). (I) ASR habituation accompanied by significant decrease in the fraction of escapes with two active M-cells (F-statistic versus constant model: 9.15, p < 0.01, adjusted R-squared = 0.028). Statistics: linear regression model analysis. Nlarvae = 29. Error bars, SEM. |
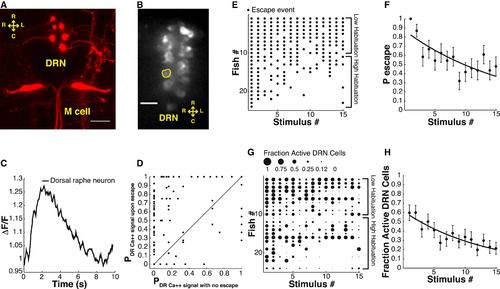
Simultaneous Analysis of ASR Behavior and Dorsal Raphe Nucleus Neuron Calcium Signals in 6 dpf Zebrafish Larvae (A) Image shows varicosities projecting from the dorsal raphe nucleus (DRN) toward the Mauthner cell dendrites (maximum projection of a z stack of confocal images, variegated individual shown for ease of demonstration). (B) Representative image of a confocal slice of DRN serotonergic neurons expressing GCaMP5. (C) Representative trace shows ROI normalized fluorescence in a single DRN neuron. (D) Probability of sound-evoked calcium responses for individual DRN neurons. Graph shows probability of sound-induced responses for individual cells during sound stimuli that did not induce escapes versus stimuli followed by escapes. (E) Acoustic startle responses of individual larvae ordered along y axis by probability of escape over the stimulus series. Each dot represents a sound-induced escape. (F) Significant decrease in ASR probability (F-statistic versus constant model: 23, p < 10-5, adjusted R-squared = 0.06). (G) Fractional activation of DRN neurons in individual larvae ordered in the y axis by probability of escape during stimulus series. The size of each dot is proportional to the number of cells activated by acoustic stimuli as a fraction of total number of analyzed individual neurons/fish. (H) Decrease in number of sound-activated DRN neurons as fraction of total number of analyzed individual neurons/fish during habituation (F-statistic versus constant model: 29.2, p < 10-6, adjusted R-squared = 0.073). Statistics: linear regression model analysis. 8-14 neurons/fish, nDRN neurons = 244, nlarvae = 24. Error bars, SEM. Scale bar, 25 µm. |
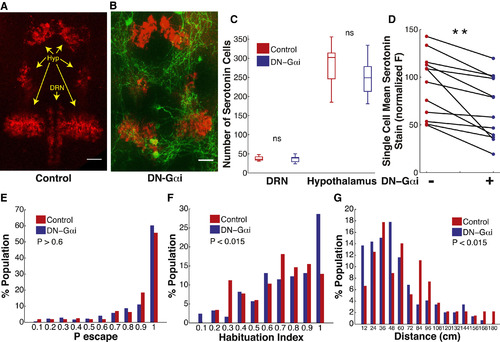
Effect on ASR Habituation of Reduced Serotonin Content in DRN Serotonergic Neurons (A-B) Representative images of labeling with serotonin antibody (red) in control larva (A) and in tg(Tph2:Gal4ff;UAS:DNGαi,gap43-citrine) larva that co-expresses DN-Gαi and citrine fluorescent protein (green) in DRN serotonergic neurons (B). Scale bars, 25 µm. (C) DRN DNGαi expressing larvae do not have significantly different numbers of serotonergic neurons in the DRN or hypothalamic serotonergic nuclei (nDN-Gαi = 11, nControl = 11, p > 0.9). Central mark of box plots is the median value, vertical edges are the 25th and 75th percentiles and whiskers are the extreme values of distribution of numbers of serotonergic neurons for each group. (D) DRN neurons co-expressing DN-Gαi and citrine fluorescent protein (green) have significantly lower mean serotonin content than neurons in the same DRN that do not express (n = 12 larvae, **p < 0.001). (E) ASR probability under non-habituating conditions in DN-Gαi expressing larvae compared to control sibling larvae (nDN-Gαi = 171, nControl = 156, z = 0.43, p > 0.06). (F) DN-Gαi larvae habituation index frequency distribution is shifted to higher values (more habituation) compared to control larvae (nDN-Gαi = 122, nControl = 116, z = 2.28, p = 0.011). (G) Frequency distribution of total displacement during 10 min in DN-Gαi larvae is shifted toward decreased displacement compared to control larvae (nDN-Gαi = 146, nControl = 106, z = 2.46, p = 0.014). Statistics: unpaired, two-tailed Student’s t test (C), paired, two-tailed Student’s t test (D), two-tailed Mann-Whitney test (E-G). |
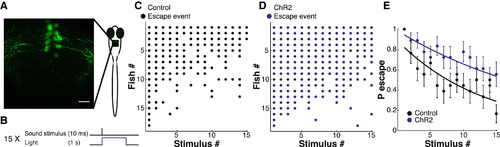
Effect on ASR Habituation of DRN Activation with Channelrhodopsin-2 (A) Representative image showing channelrhodopsin-2 (ChR2)-YFP expression in cell bodies and processes of DRN neurons in tg(tph2:Gal4ff; 14xUAS-E1b:hChR2(H134R)-EYFP) in 6 dpf larva. (B) Protocol showing single stimulus from habituation series, pairing illumination at 488 nm (to activate ChR2 in DRN neurons) with sound stimulation (to elicit the ASR). (C and D) Acoustic startle responses of all of the individual larvae ordered in the y axis by probability of escape during the stimulus series, separated into two groups from the sibling larvae: not expressing ChR2-YFP (C, Control) and those expressing ChR2-YFP (D, ChR2). Each dot represents a sound-induced escape. (E) Plots of mean ± SEM of data shown in (C) and (D) showing less habituation in siblings with ChR2 in DRN neurons (nChR2 = 18, nControl = 18, analysis of covariance, F-statistic: 28.24, p < 10-6). |
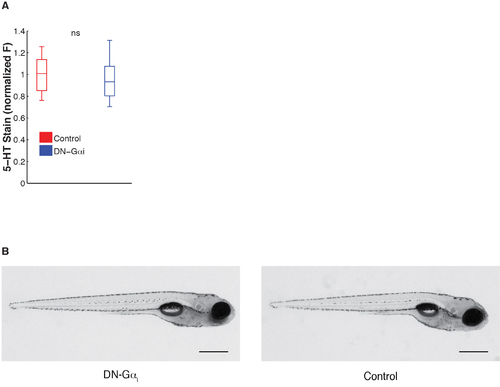
No effect on serotonin content in hypothalamus or on zebrafish morphology of expression of dominant-negative αi G-protein signaling peptide. (A) DRN DNGαi expressing larvae do not have significantly different serotonin content in the hypothalamus (normalized serotonin stain: control = 1.004 ± 0.063; DN-Gαi = 0.996 ± 0.080, P = 0.14, 2-sided student’s T-test). (B) Representative image of tg(Tph2:Gal4ff;UAS:DNGai) (DN-Gαi) or control 6 dpf transgenic zebrafish larva. Scale bars 500 µm. |