
- Title
-
The Apelin receptor enhances Nodal/TGFβ signaling to ensure proper cardiac development
- Authors
- Deshwar, A.R., Chng, S.C., Ho, L., Reversade, B., Scott, I.C.
- Source
- Full text @ Elife
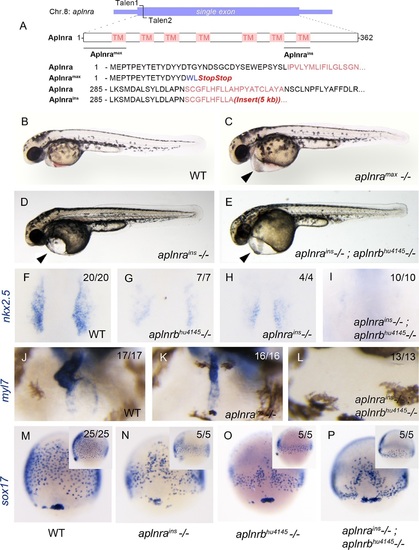
aplnra mutant embryos display defects in endoderm and heart formation. (A) Schematic detailing the aplnramax and aplnrains alleles. TM indicates the transmembrane domain. (B–E) Gross morphology of aplnramax,aplnrains and aplnrains; aplnrbhu4145 mutant embryos compared to WT (wild type) at 48 hpf (hours post-fertilization). (F-I) nkx2.5 expression at the 15 somite stage in WT, aplnrbhu4145, aplnrains, and aplnrains; aplnrbhu4145 mutant embryos. Dorsal view with anterior to the top. (J-L) In situ hybridization showing expression of myl7 at 48 hpf in aplnrains and aplnrains; aplnrbhu4145 embryos compared to WT when viewed from the anterior. (M-P) Comparison of sox17 expression at 8 hpf between WT, aplnrains, aplnrbhu4145and aplnrains; aplnrbhu4145 mutant embryos. Dorsal views are shown with a lateral view in inset panels. EXPRESSION / LABELING:
PHENOTYPE:
|
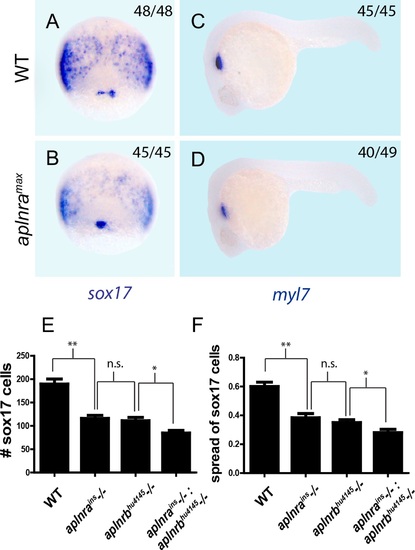
aplnra and aplnra; aplnrb double mutant characterization. (A-D) Wholemount RNA in situ hybridization (WISH) showing expression of sox17 at 8 hpf and myl7 at 24 hpf in aplnramax embryos compared to WT. (E-F) Quantification of the number and spread of sox17-positive cells in WT, aplnrains, aplnrbhu4145and aplnrains; aplnrbhu4145 embryos at 8 hpf. Data are represented as means ± SEM. *p<0.05, **p<0.01, n.s. = not significant unpaired two-tailed t-test. |
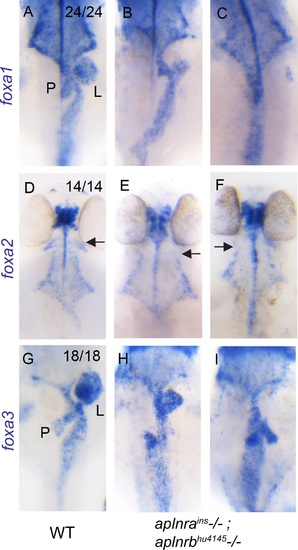
aplnra; aplnrb double mutants display defects in endodermal organ development. (A-I) WISH showing expression of foxa1 (A-C), foxa2 (D-F) and foxa3 (G-I) at 48 hpf in WT and aplnrains; aplnrbhu4145 homozygous mutant embryos. P indicates the pancreatic bud, L indicates the liver bud and the arrow indicates the most anterior pharyngeal endoderm. For double mutants, two representative images are shown for each probe (n=7 for each marker). Embryos are visualized ventrally. |
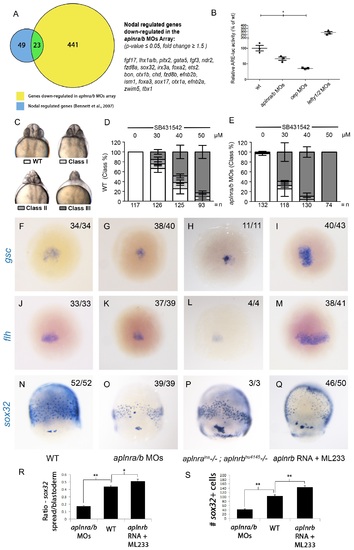
Aplnr deficient embryos exhibit a reduction in Nodal signaling. (A) List and Venn diagram of 23 Nodal target genes found to be down-regulated in a microarray of aplnra/b morphant embryos compared to WT at 50% epiboly (5.25 hpf). (B) Relative luciferase activity regulated by the Activin response element (ARE) in WT, aplnra/b morpholino (MO), oep MO and lefty1/2 MO injected embryos at 30% epiboly (4.7 hpf). Data are represented as means ± SEM. *p<0.05 unpaired two-tailed t-test. (C-E) Phenotypic characterization of WT (D) and aplnra/b morphant embryos (E) when treated with the indicated concentration of the Alk4/5/7 inhibitor SB431542 from the sphere stage (4 hpf) onwards. (F-S) Visualization of the expression of the canonical nodal target genes gsc, flh and sox32 in WT (F,J,N), aplnra/b MOs injected (G,K,O), aplnrains; aplnrbhu4145 double mutant (H,L,P) and aplnrb RNA injected treated with the Aplnr agonist ML233 (I,M,Q) embryos at 8 hpf. Embryos are viewed from the dorsal side. Quantification of the number and spread of sox32 expressing cells (R,S). Data are represented as means ± SEM. *p<0.05, **p<0.01 unpaired two-tailed t-test. EXPRESSION / LABELING:
PHENOTYPE:
|
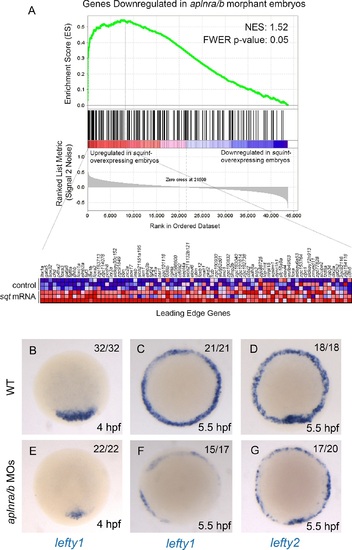
Loss of aplnr affects Nodal target gene expression. (A) Gene set enrichment analysis (GSEA) of genes downregulated in aplnra/b morphants when compared against genes upregulated in zebrafish sphere stage (4 hpf) embryos injected with sqt mRNA. (B-G) WISH showing expression of lefty1 at 4 hpf (B, E) and 5.5 hpf (C, F) and lefty2 at 5.5 hpf (D, G) in aplnra/b morphant embryos when compared to WT from an animal pole (top of embryo) view. |
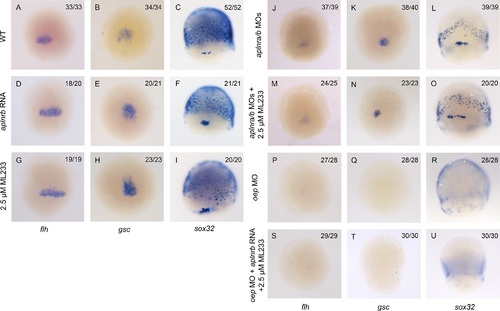
Aplnr activation enhances Nodal target gene expression. (A-I) Expression of the canonical Nodal target genes gsc, flh and sox32 in WT (A-C), aplnrb RNA injected embryos (D-F) and embryos treated with the Aplnr agonist ML233 (G-I) at 8 hpf. Embryos are viewed from the dorsal side with anterior to the top. (J-O) Expression of the canonical Nodal target genes gsc, flh and sox32 in aplnra/b morphant embryos with or without ML233 at 8 hpf. Embryos are viewed from the dorsal side with anterior to the top. (P-U) Expression of the canonical Nodal target genes gsc, flh and sox32 in oep morphant embryos with or without the injection of aplnrb RNA and addition of ML233 at 8 hpf. Embryos are viewed from the dorsal side with anterior to the top. |
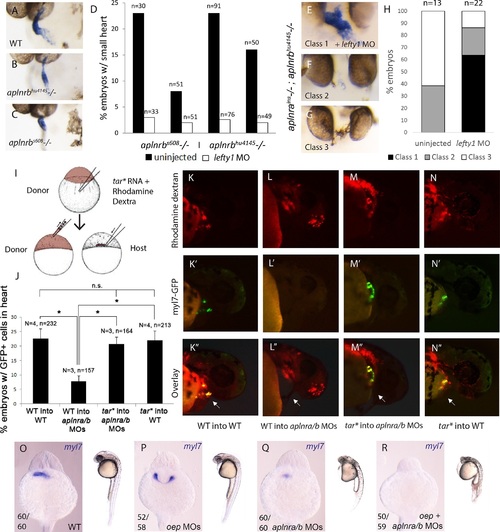
Elevation of Nodal signaling in aplnr mutant/morphant embryos rescues cardiogenesis. (AC) myl7 WISH showing a representative heart phenotype at 48 hpf in a WT embryo (A) and two different aplnrb mutant alleles; hu4145 (B) and s608/grinch (C). Anterior is oriented towards the left. (D) Quantification of the number of embryos with a small heart at 48 hpf from individual clutches of embryos in which half were injected with lefty1 MO. Clutches were obtained from crosses of two different aplnrb heterozygous mutants (hu4145 and s608/grinch as indicated). (E-H) Classification of heart phenotype in aplnrains; aplnrbhu4145 double mutant embryos at 48 hpf when injected with lefty1 MO as compared to un-injected embryos. Severity of cardiac phenotypes was scored based on myl7 WISH (H). (I) Schematic displaying the transplantation of injected donor cells into the margin of host embryos. Contribution of transplanted cells to the heart is scored based on expression of the myl7:EGFP transgene in donor cells. (J-N′′) Margin transplants of WT or tar* (activated Nodal receptor) overexpressing myl7:EGFP cells into WT or aplnra/b morphant embryos at 48 hpf. Arrow indicates the heart. Embryos are displayed from a lateral view with the anterior of the embryo towards the right. Data are represented as means ± SEM. *p<0.05, n.s. = not significant, Tukey’s Multiple Comparison test following significant (p<0.05) one way ANOVA. (O-R) Gross morphology and myl7 expression at 24 hpf in WT (O), embryos injected with a sub-optimal dose of oep MOs (P), aplnra/b morphant embryos (Q) and aplnra/b/oep morphant embryos (R). |
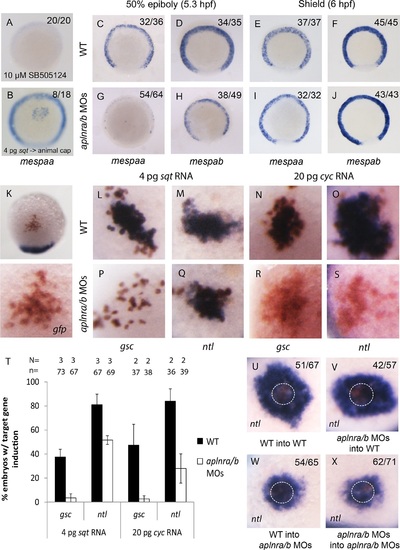
Loss of aplnr results in a delay in mesp gene expression and the attenuation of Sqt and Cyc activity in a non-cell autonomous manner by aplnr. (A) Animal view of mespaa expression at 50% epiboly (5.25 hpf) in embryos treated with 10 µM of SB505124 from 4-5.25 hpf. Animal cap view with dorsal to the bottom. (B) Animal view of mespaa expression at 50% epiboly (5.25 hpf) in embryos in which cells expressing 4 pg of sqt RNA were transplanted into the animal cap. Animal cap view with dorsal to the bottom. (C-J) Expression of mespaa and mespab at 50% epiboly (5.3 hpf) (C,D,G,H) and the shield stage (6 hpf) (E,F,I,J) in WT and aplnra/b morphant embryos when examined by WISH. Embryos are viewed from the animal pole with dorsal at the bottom. (K) Animal cap transplant of GFP expressing control cells detected by WISH. (L-T) Animal cap transplants of sqt or cyc overexpressing cells into WT (L-O) or aplnra/b morphant embryos (P-S) at 5.5 hpf. gsc and ntl expression is displayed in blue and gfp expressing donor cells are marked in brown. Both donor cells and hosts are of the same background (WT into WT or morphant into morphant). Embryos are viewed from the animal pole with dorsal at the bottom. Data are represented as means ± SEM. (U-X) Animal cap transplants of cells expressing high levels of sqt RNA at 5.5 hpf. ntl expression is visualized in blue and gfp expressing donor cells are brown. Four different combinations of donor/host cells were examined, WT into WT (donor into host) (U), aplnra/b morphant into WT (V), WT into aplnra/b morphant (W) and aplnra/b morphant into morphant (X). Donor cells are circled in white. Embryos are viewed from the animal pole with dorsal at the bottom. EXPRESSION / LABELING:
PHENOTYPE:
|
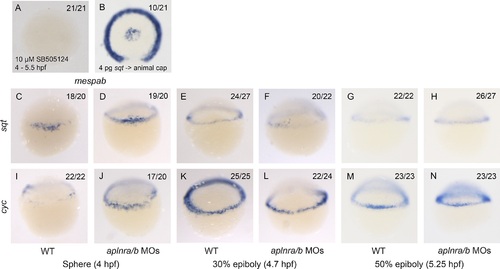
mespaa and mespab are Nodal target genes and Nodal ligand expression is not affected in aplnra/b morphant embryos. (A) Animal view of mespab expression at 50% epiboly (5.25 hpf) in embryos treated with 10 µM of SB505124 from 4-5.25 hpf. Animal cap view with dorsal to the bottom. (B) Animal view of mespab expression at 50% epiboly (5.25 hpf) in embryos in which cells expressing 4 pg of sqt RNA were transplanted into the animal cap. Animal cap view with dorsal to the bottom. (C-N) Lateral view of the Nodal ligands sqt (C-H) and cyc (I-N) expression at sphere (4 hpf), 30% epiboly (4.7 hpf) and 50% epiboly (5.25 hpf) in WT and aplnra/b morphant embryos. |