FIGURE SUMMARY
Title

Effects of copper oxide nanoparticles on developing zebrafish embryos and larvae

Authors
Sun, Y., Zhang, G., He, Z., Wang, Y., Cui, J., Li, Y.
Source
Full text @ Int. J. Nanomedicine

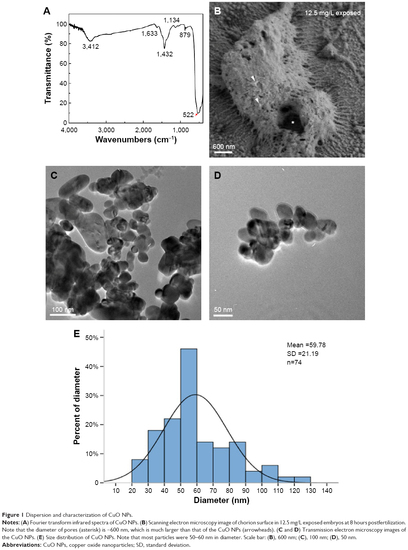
Dispersion and characterization of CuO NPs.
Notes: (A) Fourier transform infrared spectra of CuO NPs. (B) Scanning electron microscopy image of chorion surface in 12.5 mg/L exposed embryos at 8 hours postfertilization. Note that the diameter of pores (asterisk) is ~600 nm, which is much larger than that of the CuO NPs (arrowheads). (C and D) Transmission electron microscopy images of the CuO NPs. (E) Size distribution of CuO NPs. Note that most particles were 50–60 nm in diameter. Scale bar: (B), 600 nm; (C), 100 nm; (D), 50 nm.
Abbreviations: CuO NPs, copper oxide nanoparticles; SD, standard deviation.

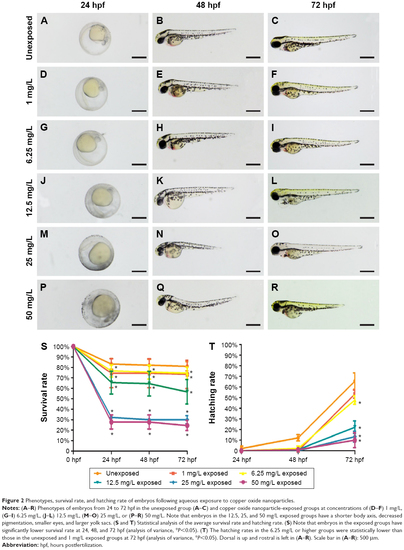
Phenotypes, survival rate, and hatching rate of embryos following aqueous exposure to copper oxide nanoparticles.
Notes: (AR) Phenotypes of embryos from 24 to 72 hpf in the unexposed group (AC) and copper oxide nanoparticle-exposed groups at concentrations of (DF) 1 mg/L, (GI) 6.25 mg/L, (JL) 12.5 mg/L, (MO) 25 mg/L, or (PR) 50 mg/L. Note that embryos in the 12.5, 25, and 50 mg/L exposed groups have a shorter body axis, decreased pigmentation, smaller eyes, and larger yolk sacs. (S and T) Statistical analysis of the average survival rate and hatching rate. (S) Note that embryos in the exposed groups have significantly lower survival rate at 24, 48, and 72 hpf (analysis of variance, *P<0.05). (T) The hatching rates in the 6.25 mg/L or higher groups were statistically lower than those in the unexposed and 1 mg/L exposed groups at 72 hpf (analysis of variance, *P<0.05). Dorsal is up and rostral is left in (AR). Scale bar in (AR): 500 μm.
Abbreviation: hpf, hours postfertilization.

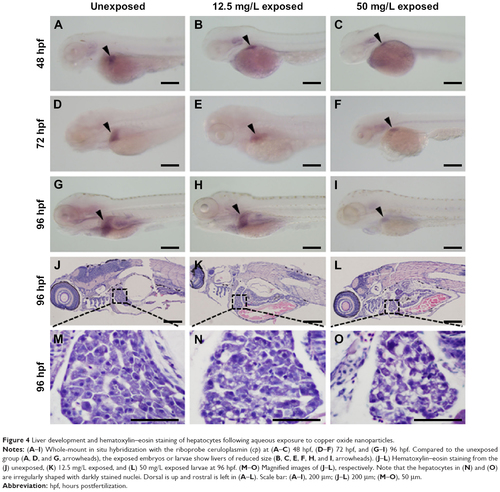
Liver development and hematoxylin–eosin staining of hepatocytes following aqueous exposure to copper oxide nanoparticles.
Notes: (AI) Whole-mount in situ hybridization with the riboprobe ceruloplasmin (cp) at (AC) 48 hpf, (DF) 72 hpf, and (GI) 96 hpf. Compared to the unexposed group (A, D, and G, arrowheads), the exposed embryos or larvae show livers of reduced size (B, C, E, F, H, and I, arrowheads). (JL) Hematoxylin–eosin staining from the (J) unexposed, (K) 12.5 mg/L exposed, and (L) 50 mg/L exposed larvae at 96 hpf. (MO) Magnified images of (JL), respectively. Note that the hepatocytes in (N) and (O) are irregularly shaped with darkly stained nuclei. Dorsal is up and rostral is left in (AL). Scale bar: (AI), 200 μm; (JL) 200 μm; (MO), 50 μm.
Abbreviation: hpf, hours postfertilization.

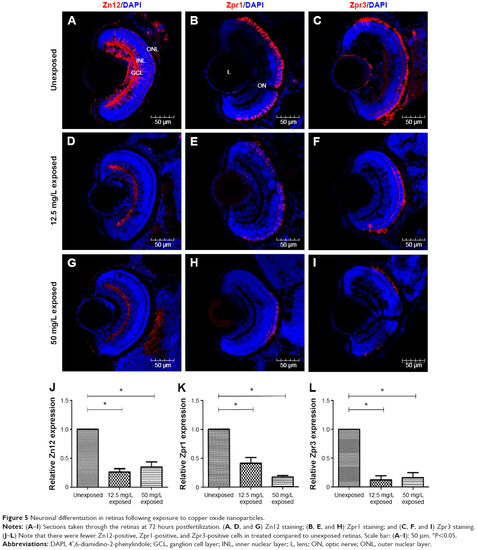
Neuronal differentiation in retinas following exposure to copper oxide nanoparticles.
Notes: (AI) Sections taken through the retinas at 72 hours postfertilization. (A, D, and G) Zn12 staining; (B, E, and H) Zpr1 staining; and (C, F, and I) Zpr3 staining. (JL) Note that there were fewer Zn12-positive, Zpr1-positive, and Zpr3-positive cells in treated compared to unexposed retinas. Scale bar: (AI): 50 μm. *P<0.05.
Abbreviations: DAPI, 4′,6-diamidino-2-phenylindole; GCL, ganglion cell layer; INL, inner nuclear layer; L, lens; ON, optic nerve; ONL, outer nuclear layer.

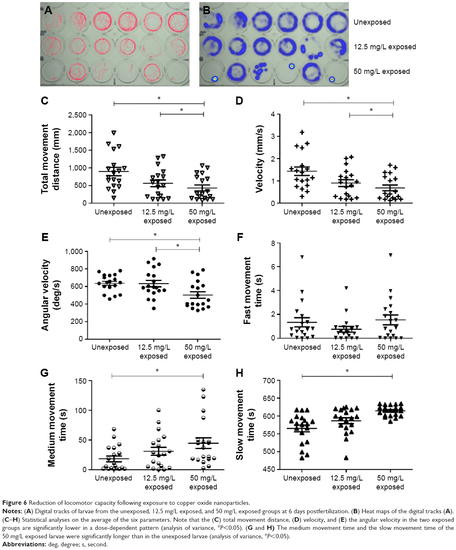
Reduction of locomotor capacity following exposure to copper oxide nanoparticles.
Notes: (A) Digital tracks of larvae from the unexposed, 12.5 mg/L exposed, and 50 mg/L exposed groups at 6 days postfertilization. (B) Heat maps of the digital tracks (A). (CH) Statistical analyses on the average of the six parameters. Note that the (C) total movement distance, (D) velocity, and (E) the angular velocity in the two exposed groups are significantly lower in a dose-dependent pattern (analysis of variance, *P<0.05). (G and H) The medium movement time and the slow movement time of the 50 mg/L exposed larvae were significantly longer than in the unexposed larvae (analysis of variance, *P<0.05).
Abbreviations: deg, degree; s, second.

Acknowledgments
This image is the copyrighted work of the attributed author or publisher, and ZFIN has permission only to display this image to its users. Additional permissions should be obtained from the applicable author or publisher of the image. Full text @ Int. J. Nanomedicine