
- Title
-
Visual Cue-Discriminative Dopaminergic Control of Visuomotor Transformation and Behavior Selection
- Authors
- Yao, Y., Li, X., Zhang, B., Yin, C., Liu, Y., Chen, W., Zeng, S., Du, J.
- Source
- Full text @ Neuron
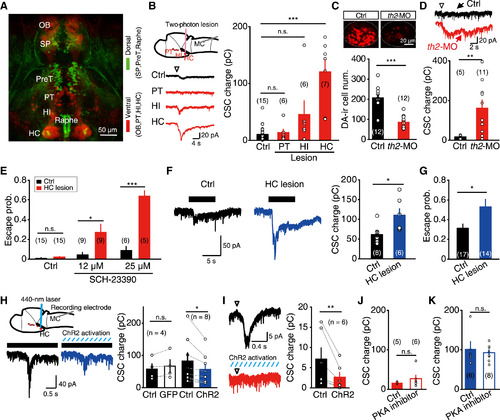
Hypothalamic Dopaminergic Neurons Control Visuomotor Transformation (A) Projected confocal pseudocolor image of a 5 dpf ETvmat2:GFP larva, in which GFP was expressed in monoaminergic neurons. HC, caudal hypothalamus; HI, intermedial hypothalamus; OB, olfactory bulb; PreT, pretectum; PT, posterior tuberculum; Raphe, raphe nucleus; SP, subpallium. Green and red indicate relative dorsal and ventral distribution, respectively. (B) Effects of two-photon laser-based lesion of dopaminergic neurons in the PT, HI, and HC on MC flash responses. Left top, schematic of experiment paradigm; left bottom, samples of MC responses under control or lesion conditions; right, summary. (C) Example (top) and summary (bottom) of data showing the effect of MO-based th2 knockdown (“th2-MO”) on the number of dopamine-immunoreactive neurons in the HC. (D) Example (top) and summary (bottom) of data showing the effect of MO-based th2 knockdown on MC responses evoked by 15 ms flash stimuli (arrowhead at top). (E) Effects of HC lesion on the probability of flash-evoked escape behavior in the control (Ctrl) condition or in the presence of low doses of SCH-23390 (12 µM or 25 µM). (F) Example (left) and summary (right) of data showing the effect of HC lesion on expanding stimulus-evoked responses of MCs. (G) Effects of HC lesion on the probability of expanding stimulus-evoked escape behavior. (H) Effect of the optogenetic activation of HC dopaminergic neurons on expanding stimulus-evoked MC responses. Left top, schematic of experimental paradigm: in vivo whole-cell recording was performed in one MC, and 440 nm laser was used to scan the middle layer of the ipsilateral HC in Tg(DAT:ChR2) larvae. Left bottom, sample traces showing MC responses evoked by expanding stimuli under the control condition (“Ctrl”) or optogenetic activation (“ChR2 activation”). Both sample traces are averaged of 5 trials. The italic blue lines represent 440 nm laser stimulation. Right, summary. (I) Example (left) and summary (right) of data showing the effect of the optogenetic activation of HC dopaminergic neurons on flash-evoked MC responses. (J and K) Effect of intracellular loading of the PKA inhibitor PKI (6-22) amide on flash- (J) or expanding stimulus-evoked (K) MC responses. n.s., not significant; *p < 0.05, **p < 0.01, ***p < 0.001; error bars, SEM. See also Figure S3. |
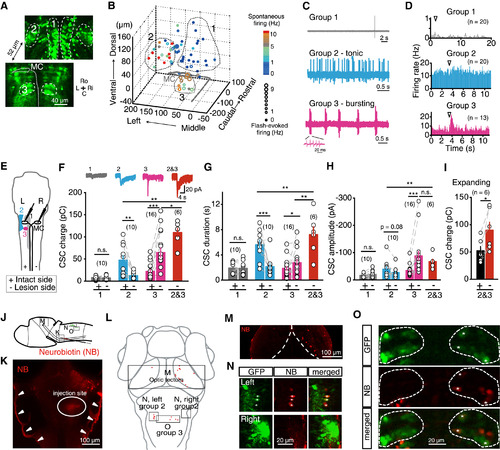
Hindbrain Inhibitory Interneurons Mediate Dopaminergic Control (A)Confocal images from a 6 dpf Tg(GlyT2:GFP) larva showing the distribution of glycinergic interneurons around MCs in the hindbrain. The numbers “1,” “2,” and “3” indicate the location of glycinergic interneuron groups analyzed in (B)–(D). C, caudal; L, left; Ri, right, Ro, rostral. Each image shown is from one optical slice. (B) 3D plot of the distribution of glycinergic interneurons, which exhibited spatial location-dependent functional properties. The frequencies of spontaneous and flash-evoked spiking activities are color- and symbol size-coded, respectively. Filled circles represent neurons irresponsive to flash stimuli. The three groups were roughly classified based on the spatial location and functional properties. The thick gray lines outline the MC morphology. (C) Sample traces showing spontaneous firing activities of the three groups of glycinergic interneurons. (D) Summary of 15 ms flash-evoked firing responses of the three groups of glycinergic interneurons. (E) Schematic of two-photon lesion of glycinergic interneurons and in vivo whole-cell recording of bilateral MCs. +, intact side; - , lesion side. (F-H) Effects of the lesion of the group 1, 2, 3, or both 2 and 3 on the total integrated charge (F), duration (G), and amplitude (H) of MC CSCs evoked by 15 ms flash stimuli. (I) Effect of the lesion of both contralateral group 2 and ipsilateral group 3 on the total integrated charge of expanding stimulus-evoked MC CSCs. (J-O) Retrograde tracing of glycinergic interneurons and optic tectal neurons by local injection of neurobiotin (NB) at the vicinity of MC ventral dendrites in a 6 dpf Tg(GlyT2:GFP) larva. (J) Schematic of the locations of injection and imaging. (K) Injection site (ellipse) at the right hindbrain. Arrowheads indicate non-specific signals on the skin. (L) Schematic showing the location of images in (M)-(O). Single optic slices from different layers of the outlined areas are enlarged in (M)-(O). (M) NB-positive neurons in the ipsilateral optic tectum. (N) NB-positive glycinergic interneurons in the contralateral (“Left”), but not ipsilateral (“Right”), group 2. Asterisks indicate both NB- and GFP-positive cells. Based on z stack images, there were 6 NB-positive cells in the left brain, and 4 of them were also GFP-positive, whereas there were 3 NB-positive cells in the right, and none of them were co-labeled by GFP. (O) NB-positive glycinergic interneurons in the ipsilateral (right side), but not contralateral (left side), group 3. Asterisks indicate both NB- and GFP-positive cells. Based on z stack images, there were 4 NB-positive cells in the left, and none of them were co-labeled by GFP, whereas there were 13 NB-positive cells in the right, and 10 of them were also GFP positive. n.s., not significant; p < 0.05, p < 0.01, p < 0.001; error bars, SEM. See also Figures S4 and S5. |
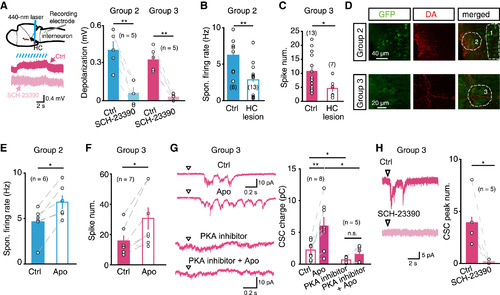
HC Dopaminergic Neurons Directly Modulate Hindbrain Glycinergic Interneurons via D1Rs (A) Effect of the optogenetic activation of HC dopaminergic neurons on the membrane potential of hindbrain glycinergic interneurons. Left top, schematic of experimental paradigm: in vivo whole-cell recording was performed in glycinergic interneurons, and a 440 nm laser was used to scan the middle layer of the ipsilateral HC in double transgenic Tg (GlyT2:GFP,DAT:ChR2) larvae. Left bottom, sample traces showing that HC optogenetic activation-induced depolarization of glycinergic interneurons was blocked by SCH-23390 application. Right, summary. (B and C) Effects of HC lesion on the spontaneous firing of the group 2 (B) and flash-evoked firing of the group 3 (C) glycinergic interneurons. (D) Double immunostaining showing dopamine-immunoreactive fibers in the areas of the groups 2 (top) and 3 (bottom) glycinergic interneurons in a 6 dpf Tg(GlyT2:GFP) larva. (E and F) Effects of apomorphine (“Apo”) application on the spontaneous firing of the group 2 (E) and flash-evoked firing of the group 3 (F) glycinergic interneurons. (G) Flash-evoked CSCs in the group 3 glycinergic interneurons before and after application of apomorphine in the absence or presence of intracellular PKA inhibitor. Left, sample traces with the top two obtained from one interneuron and the bottom two from another interneuron. Right, summary. (H) Effect of local puffing of SCH-23390 on flash-evoked CSCs in the group 3 glycinergic interneurons. Left, sample traces. Right, summary. *p < 0.05, **p < 0.01; error bars, SEM. See also Figure S6. |
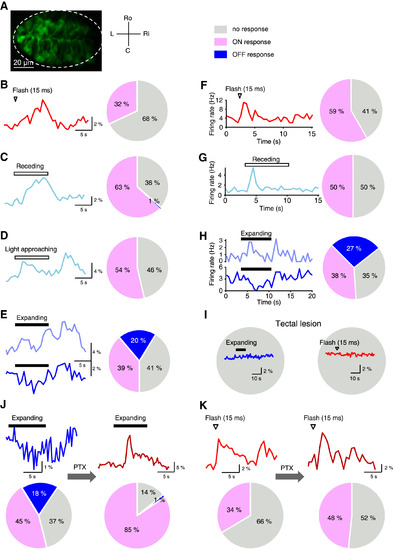
Properties of HC Dopaminergic Neurons’ Visual Responses (A) In vivo confocal image of a 6-dpf Tg (DAT:Gal4,UAS:GCaMP5) larva showing GCaMP5 expression in HC dopaminergic neurons. Single optic slice at the middle layer of the HC was imaged. The dashed ellipse outlines the HC. C, caudal; L, left; Ri, right; Ro, rostral. (B-E) In vivo calcium imaging data showing flash-evoked (B), receding-evoked (C), light approaching-evoked (D), and expanding stimulus-evoked (E) responses of HC dopaminergic neurons. Left panels, sample traces from the same larva. Each trace is the average of all responsive trials from all responsive neurons in the fish, except the traces in (E), which are the average of all ON-response trials (top) and all OFF-response trials (bottom), respectively. Right, pie charts showing the distribution of response types. ON response, OFF response, and no response are presented by pink, blue, and gray colors, respectively. Data were obtained from 405 HC dopaminergic neurons in 15 larvae. (F-H) In vivo cell-attached recording data showing flash-evoked (F), receding-evoked (G), and expanding stimulus-evoked (H) responses of HC neurons. Left, sample traces showing the response pattern of responsive neurons. Each trace is the average of 4 (F) or 5 (G and H) trials. Right, pie charts showing the distribution of response types. Data were obtained from 49 (F), 38 (G), and 52 (H) HC neurons. (I) Effect of bilateral lesion of the optic tectum on expanding stimulus- and flash stimulus-evoked responses of HC dopaminergic neurons. Data were obtained from 155 HC neurons in 5 larvae. Traces on pie charts represent typical responses from 42 (left) and 35 (right) cells. (J and K) Effect of local puffing of PTX into the HC on expanding stimulus-evoked (J) and flash stimulus-evoked (K) responses of HC dopaminergic neurons. Data were obtained from 155 neurons in 6 larvae. (J) Inhibition blockade effect on expanding stimulus-evoked responses of HC dopaminergic neurons. Top, sample traces from the same 7 cells showing expanding stimulus-evoked calcium responses before (left) and after (right) local puffing of PTX into the HC. Bottom, pie charts showing response type distribution of HC dopaminergic neuron before (left) and after (right) PTX application. (K) Effect of inhibition blockade on flash-evoked responses of HC dopaminergic neurons. Top, sample traces from the same 2 cells showing flash-evoked calcium responses before (left) and after (right) local puffing of PTX into the HC. Bottom, pie charts showing response type distribution of HC dopaminergic neuron before (left) and after (right) PTX application. See also Figure S7 and Tables S1–S5. |
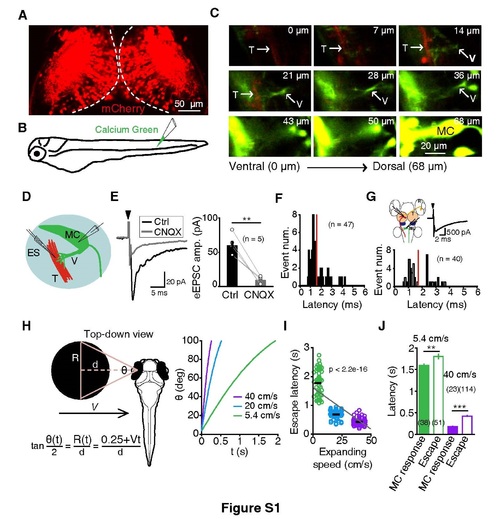
Related to Figure 1. Functional Synaptic Connections Formed by Tectal Projection Fibers on the Ventral Dendrite of MCs and Temporal Profiles of Expanding Stimuli and Related Responses. (A) Confocal image of an enhancer trap mCherry-Gal4 line (MÜ4023-19) larva at 5 dpf, showing that some optic tectal neurons express mCherry (in red). (B) Schematic of Calcium Green injection into the caudal spinal cord of a MÜ4023-19 larva for retrograde labeling. (C) Sequence of confocal images showing co-localization between the descending tectal projection fibers (“T”, red) of the optic tectum and the ventral dendrites (“V”, green) of the MC in a 5-dpf MÜ4023-19 larva. Z-axis resolution: 1.78 µm/slice. (D) Schematic of the electrical stimulation (“ES”) of tectal projection fibers (“T”, in red) and in vivo whole-cell recording of MCs (in green). (E) Sample (left) and summary (right) of data showing that electrical stimulation (filled arrowhead in left) of tectal projection fibers evoked excitatory postsynaptic currents (eEPSCs) in MCs (voltage clamp, held at -60 mV) that were largely blocked by 6-cyano-7-nitroquinoxaline-2,3-dione (CNQX), an antagonist of the α-amino-3-hydroxy-5-methyl-4-isoxazole propionic acid subtype of glutamate receptors (AMPARs). (F) Distribution of eEPSC latency. The red line indicates the mean value of latency (1.6 ± 0.1 ms). (G) eEPSCs in MC evoked by electric stimulation of the tectal soma layer. Top left, schematic of the electrical stimulation of tectal somata (“T”, in red) and in vivo whole-cell recording of MCs (‘MC’, in green). R, retinal ganglion cell. Top right, sample trace showing an eEPSC. Filled arrow indicates the onset of electrical stimulation. Bottom, histogram showing the distribution of eEPSC latency. The red line indicates the mean value of latency (1.7 ± 0.1 ms). The stimulation electrode was put in the middle posterior region of the optic tectum (OT) and the success rate for evoking an EPSC is 53%. (H) Parameters of expanding stimuli. A black disc was expanded at a constant velocity V. Left, top-down view of a black disc with an initial radius 0.25 cm from a distance d approaching to the larva from the left side. R, the radius of the black disc. θ, the angle of the black disc relative to the larva’s left eye. t, the time after stimulus onset. As the black disc expands, R and θ change as function of t. Right, plot of θ to t at three different V. (I) Plot of escape behavior’s latency against expanding stimulus’s speed. Black short lines represent the average value of each group, and the grey line represents linear fit of the data (least-squares linear regression [y = -34.96x + 1741], p < 2.2e-16 from 226 responses across all velocities). (J) Comparison of the latencies between expanding stimulus-evoked MC responses and escape behaviors. The latency of MC responses was measured between the onsets of expanding stimuli and MC responses. **p< 0.01; ***p< 0.001; error bars, SEM. |
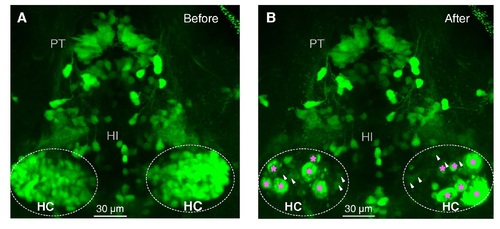
Related to Figure 3. Two-Photon Images Taken Before and After Lesion of HC Dopaminergic Neurons. (A and B) Before (A) and after (B) two-photon laser-based lesion of the bilateral HC dopaminergic neurons in a 5-dpf ETvmat2:GFP larva. The pink asterisks indicate bulb-like structures, which suggest successful lesion, and the white arrowheads indicate remaining dopaminergic neurons. |