
|
Fig. S1
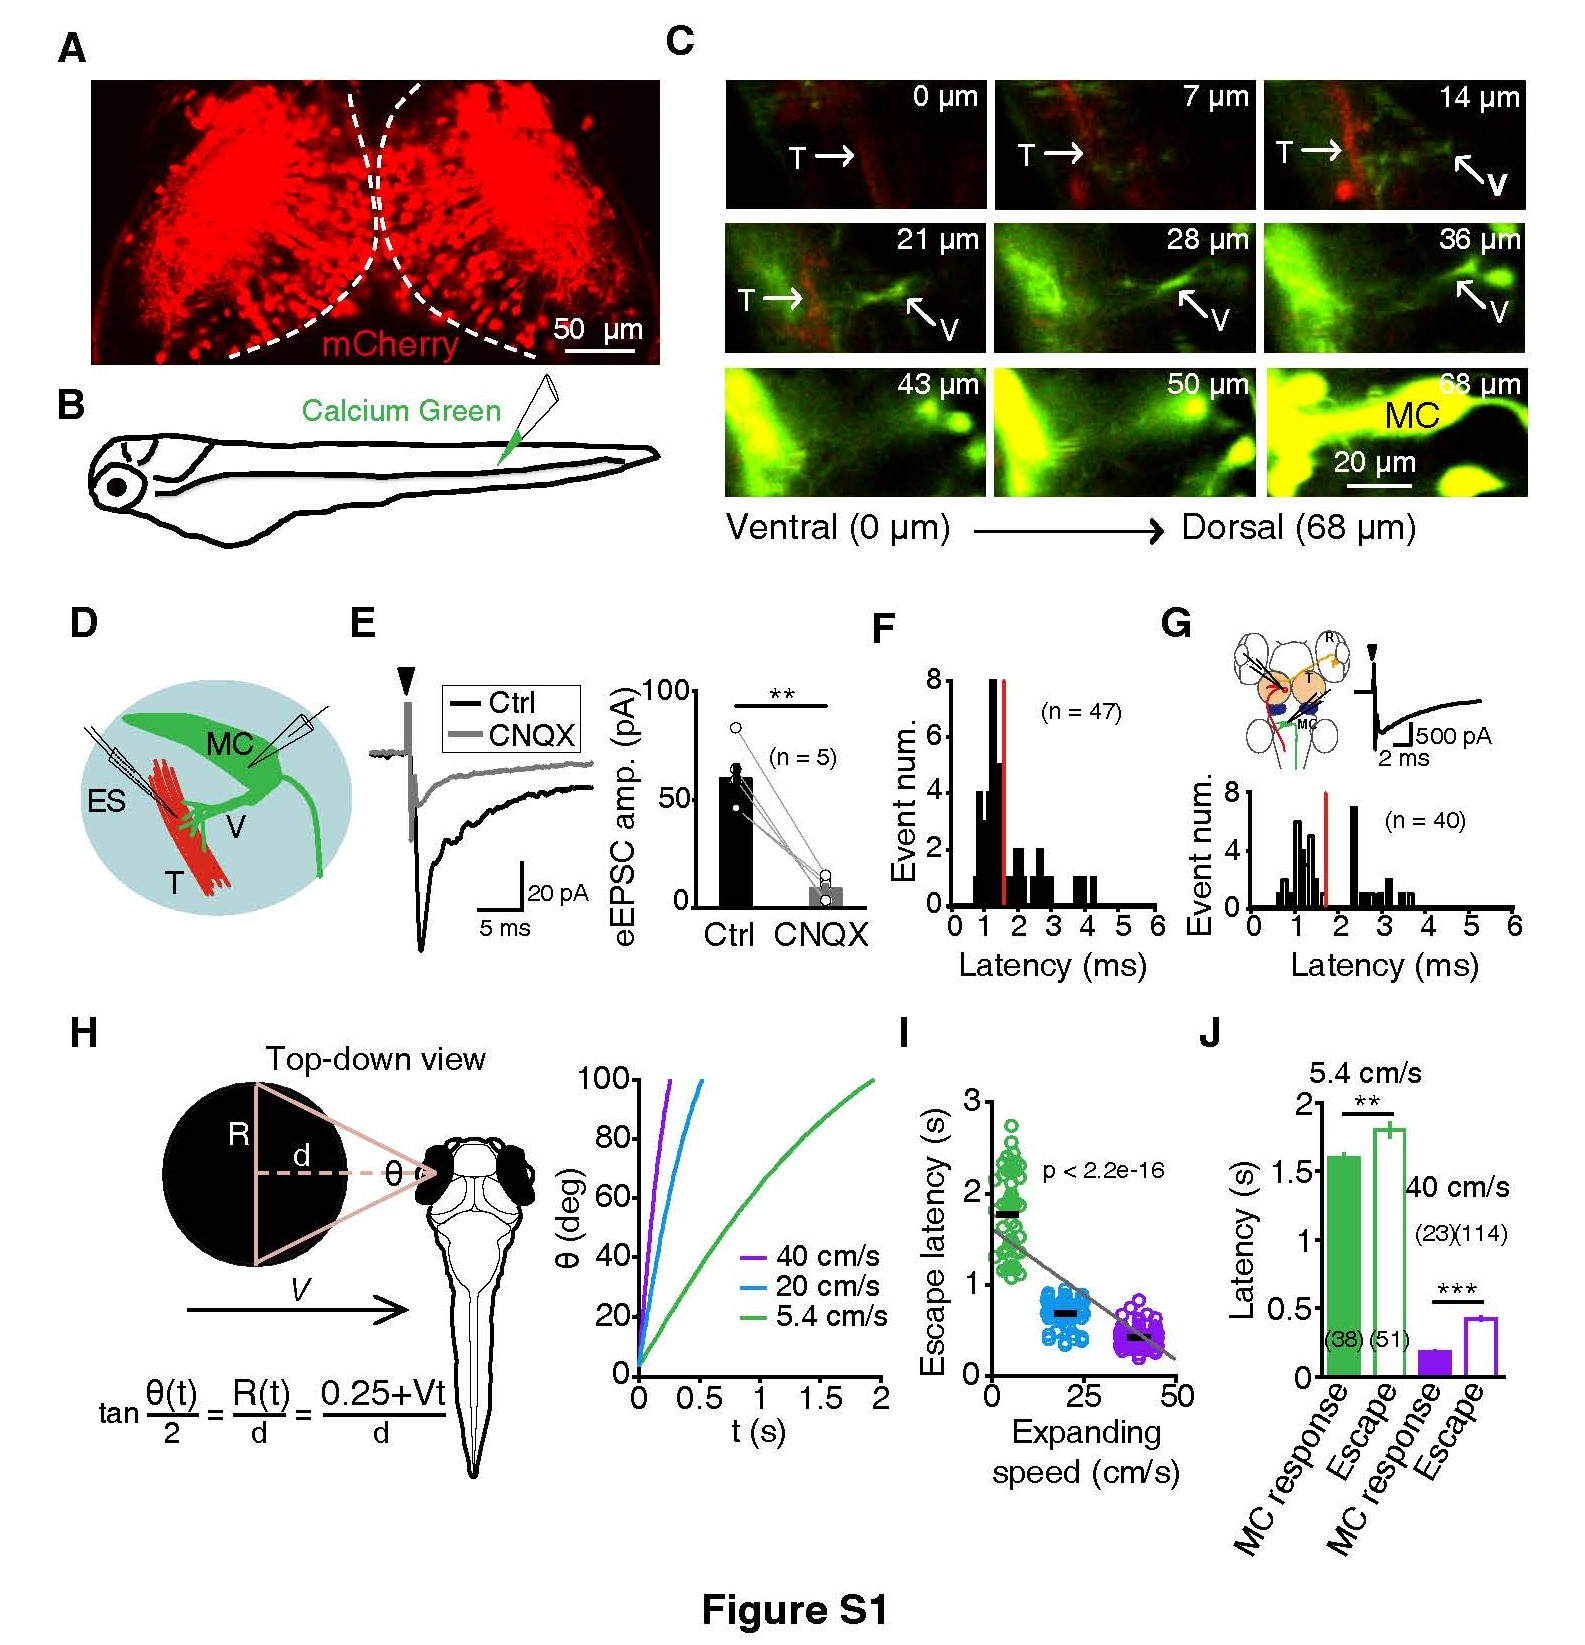
Related to Figure 1. Functional Synaptic Connections Formed by Tectal Projection Fibers on the Ventral Dendrite of MCs and Temporal Profiles of Expanding Stimuli and Related Responses.
(A) Confocal image of an enhancer trap mCherry-Gal4 line (MÜ4023-19) larva at 5 dpf, showing that some optic tectal neurons express mCherry (in red).
(B) Schematic of Calcium Green injection into the caudal spinal cord of a MÜ4023-19 larva for retrograde labeling.
(C) Sequence of confocal images showing co-localization between the descending tectal projection fibers (“T”, red) of the optic tectum and the ventral dendrites (“V”, green) of the MC in a 5-dpf MÜ4023-19 larva. Z-axis resolution: 1.78 µm/slice.
(D) Schematic of the electrical stimulation (“ES”) of tectal projection fibers (“T”, in red) and in vivo whole-cell recording of MCs (in green).
(E) Sample (left) and summary (right) of data showing that electrical stimulation (filled arrowhead in left) of tectal projection fibers evoked excitatory postsynaptic currents (eEPSCs) in MCs (voltage clamp, held at -60 mV) that were largely blocked by 6-cyano-7-nitroquinoxaline-2,3-dione (CNQX), an antagonist of the α-amino-3-hydroxy-5-methyl-4-isoxazole propionic acid subtype of glutamate receptors (AMPARs).
(F) Distribution of eEPSC latency. The red line indicates the mean value of latency (1.6 ± 0.1 ms).
(G) eEPSCs in MC evoked by electric stimulation of the tectal soma layer. Top left, schematic of the electrical stimulation of tectal somata (“T”, in red) and in vivo whole-cell recording of MCs (‘MC’, in green). R, retinal ganglion cell. Top right, sample trace showing an eEPSC. Filled arrow indicates the onset of electrical stimulation. Bottom, histogram showing the distribution of eEPSC latency. The red line indicates the mean value of latency (1.7 ± 0.1 ms). The stimulation electrode was put in the middle posterior region of the optic tectum (OT) and the success rate for evoking an EPSC is 53%.
(H) Parameters of expanding stimuli. A black disc was expanded at a constant velocity V. Left, top-down view of a black disc with an initial radius 0.25 cm from a distance d approaching to the larva from the left side. R, the radius of the black disc. θ, the angle of the black disc relative to the larva’s left eye. t, the time after stimulus onset. As the black disc expands, R and θ change as function of t. Right, plot of θ to t at three different V.
(I) Plot of escape behavior’s latency against expanding stimulus’s speed. Black short lines represent the average value of each group, and the grey line represents linear fit of the data (least-squares linear regression [y = -34.96x + 1741], p < 2.2e-16 from 226 responses across all velocities).
(J) Comparison of the latencies between expanding stimulus-evoked MC responses and escape behaviors. The latency of MC responses was measured between the onsets of expanding stimuli and MC responses.
**p< 0.01; ***p< 0.001; error bars, SEM.