
- Title
-
In Vivo Ca(2+) Imaging Reveals that Decreased Dendritic Excitability Drives Startle Habituation
- Authors
- Marsden, K.C., Granato, M.
- Source
- Full text @ Cell Rep.
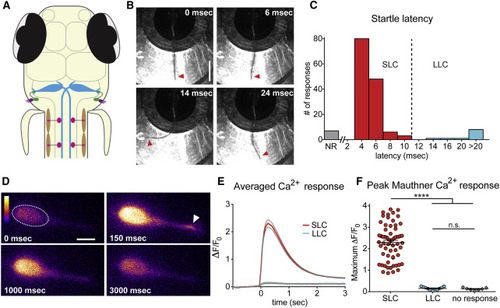
The Mauthner Cell Is Active Only during Short-Latency C-Bends and Not during Long-Latency C-Bends (A) The larval zebrafish acoustic startle circuit: hair cells in the otic vesicle (purple), VIII nerve afferents (green), hindbrain Mauthner cells (M-cells, blue), spinal motor neurons (pink), and contraction of muscle (brown). (B) High-speed images (500 Hz) of a short-latency C-bend (SLC) in a head-restrained 5-dpf larva. Arrowheads highlight tail (scale bar, 1 mm). (C) Distribution of startle latencies in head-restrained larvae (NR, no response; LLC, long-latency C-bend). (D) Representative example of M-cell activation following acoustic stimulation in a Gal4FF62a;UAS:GCaMP6s transgenic larva. Arrowhead highlights lateral dendrite activation. Color scale denotes fluorescence intensity (black, lowest; white, highest; scale bar, 10 µm). (E) Averaged traces show change in fluorescence (ΔF) relative to baseline (F0) for SLC (red) and LLC (blue) responses performed to the contralateral side of the imaged M-cell. Gray lines indicate SEM. (F) Scatterplot of peak ΔF/F0 values for contralateral SLCs, LLCs, and NRs. (p < 0.0001, t test). Error bars indicate SEM. |
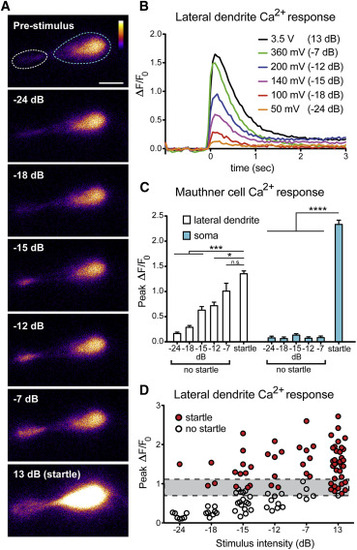
Graded M-Cell Lateral Dendrite Ca2+ Signals Reflect Startle Probability (A) Increasing stimulus intensity increases activity at the M-cell lateral dendrite (white dashed line), with no change in somatic (blue dashed line) activity unless a startle is performed (scale bar, 10µm). (B) Representative ΔF/F0 traces from a single M-cell show graded lateral dendrite responses. Stimuli were calibrated with an accelerometer, with voltage outputs converted to dB using the formula dB = 20 log (V/0.775). (C) Grouped ΔF/F0 data reveal all-or-none somatic activity (blue bars) in startles versus non-startles regardless of stimulus intensity and graded lateral dendrite activity (white bars; p < 0.05, p < 0.001, p < 0.0001, one-way ANOVA with Dunnett’s multiple comparison test). Error bars indicate SEM. (D) Scatterplot of peak lateral dendrite ΔF/F0 with startle events in red and no startle events in white. Gray bar indicates the lateral dendrite activation threshold for startle behavior. |
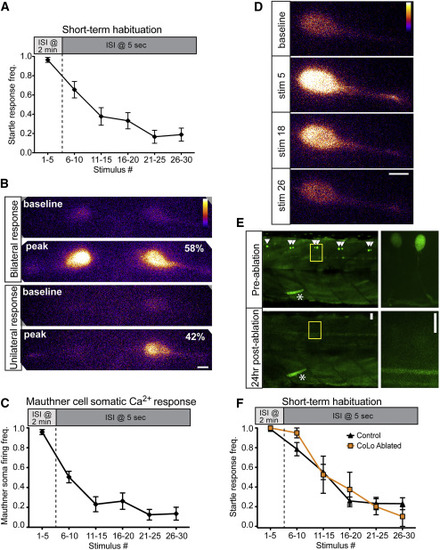
Inhibition Downstream of the M-Cell Does Not Cause Startle Habituation (A) A 30-stimulus assay (5 pulses at 2 min ISI and 25 pulses at 5 s ISI) induced robust startle habituation in head-restrained larvae. Error bars indicate SEM. (B) 40× magnification images of bilateral M-cell GCaMP6s labeling demonstrate unilateral (bottom, 42%) and bilateral (top, 58%) M-cell firing (n = 50 responses from five fish; scale bar, 10 µm). (C) The frequency of M-cell somatic Ca2+ responses during short-term habituation is strongly reduced during habituation. Error bars indicate SEM. (D) Representative images show baseline and peak fluorescence for non-habituating (stim 5) and habituating stimuli (stim 18 and 26; scale bar, 10 µm). (E) Representative images at 10× (left) and 63× (right) show pre-ablation labeling of CoLo interneurons and their absence 24 hr post-ablation. Asterisk highlights a GFP-labeled muscle cell to indicate the same segments are imaged pre- and post-ablation (scale bar 10 µm). (F) Both control and CoLo-ablated larvae rapidly habituate to repeated acoustic stimulation. Error bars indicate SEM. |
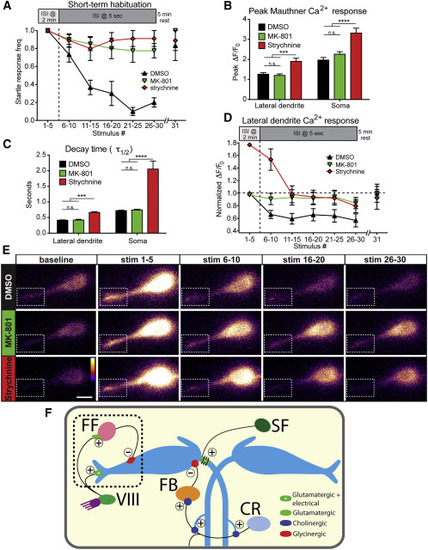
PSP Depression Drives Short-Term Startle Habituation (A) 500 µM MK-801 (n = 8) and 100 µM strychnine (n = 9) strongly reduce short-term habituation of the startle response compared to DMSO-treated controls (n = 8). A 5-min rest period allows complete recovery to the 31st stimulus. (B) Peak ΔF/F0 levels in M-cell lateral dendrite and soma are unaffected by MK-801 but are increased by strychnine (p < 0.001, p < 0.0001, t test). (C) Ca2+ signal decay kinetics are unaltered by MK-801 but are increased by strychnine (p < 0.001, p < 0.0001, t test). (D) Normalized M-cell lateral dendrite Ca2+ responses are decreased ~35% in DMSO-treated fish during habituation while MK-801 treatment prevented this decrease (p < 0.0001, two-way ANOVA). Responses in strychnine-treated larvae decreased from a higher baseline but remained elevated compared DMSO-treated larvae (p < 0.0001, two-way ANOVA). (E) Representative images for each block of five stimuli show PSP depression in DMSO compared to MK-801- and strychnine-treated fish. Dashed box highlights lateral dendrite (scale bar, 10 µm). (F) Diagram of the M-cell circuit including known regulatory inputs. Startle habituation arises from an NMDA- and glycine-receptor dependent mechanism that likely results in enhanced transmission from feedforward (FF) inhibitory neurons to the M-cell and may involve depression of acoustic nerve (VIII) inputs to the M-cell. Inputs from downstream spiral fiber (SF), cranial relay (CR), and feedback inhibitory (FB) neurons are most likely not involved in startle habituation. Excitatory (+) and inhibitory () connections are labeled. In (A)–(D), error bars indicate SEM. |
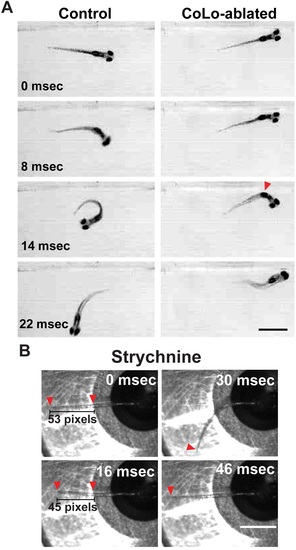
CoLo ablation and strychnine treatment cause abnormal startle responses, Related to Figures 3 and 4. (A) Free-swimming control larvae perform normal startle responses to acoustic stimulation while CoLo-ablated larvae respond at normal latency but with altered kinematics. The tail caudal to the CoLo ablations (red arrowhead) straightens rather than contracting on one side (scale bar 10 µm). (B) Representative example of abnormal startle after 100 µM strychnine treatment in headrestrained larvae. Movement initiates at 8 ms (not shown), and the tail straightens and shortens (16 ms, indicated by red arrowheads), followed by a normal counterbend (30 ms) and relaxation (46 ms). |