
Fig. 1
- ID
- ZDB-FIG-160205-84
- Publication
- Marsden et al., 2015 - In Vivo Ca(2+) Imaging Reveals that Decreased Dendritic Excitability Drives Startle Habituation
- Other Figures
- All Figure Page
- Back to All Figure Page
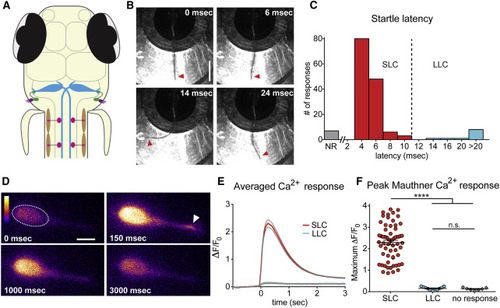
The Mauthner Cell Is Active Only during Short-Latency C-Bends and Not during Long-Latency C-Bends (A) The larval zebrafish acoustic startle circuit: hair cells in the otic vesicle (purple), VIII nerve afferents (green), hindbrain Mauthner cells (M-cells, blue), spinal motor neurons (pink), and contraction of muscle (brown). (B) High-speed images (500 Hz) of a short-latency C-bend (SLC) in a head-restrained 5-dpf larva. Arrowheads highlight tail (scale bar, 1 mm). (C) Distribution of startle latencies in head-restrained larvae (NR, no response; LLC, long-latency C-bend). (D) Representative example of M-cell activation following acoustic stimulation in a Gal4FF62a;UAS:GCaMP6s transgenic larva. Arrowhead highlights lateral dendrite activation. Color scale denotes fluorescence intensity (black, lowest; white, highest; scale bar, 10 µm). (E) Averaged traces show change in fluorescence (ΔF) relative to baseline (F0) for SLC (red) and LLC (blue) responses performed to the contralateral side of the imaged M-cell. Gray lines indicate SEM. (F) Scatterplot of peak ΔF/F0 values for contralateral SLCs, LLCs, and NRs. (p < 0.0001, t test). Error bars indicate SEM. |