
- Title
-
CCAAT/enhancer-binding protein α is required for hepatic outgrowth via the p53 pathway in zebrafish
- Authors
- Yuan, H., Wen, B., Liu, X., Gao, C., Yang, R., Wang, L., Chen, S., Chen, Z., de The, H., Zhou, J., Zhu, J.
- Source
- Full text @ Sci. Rep.
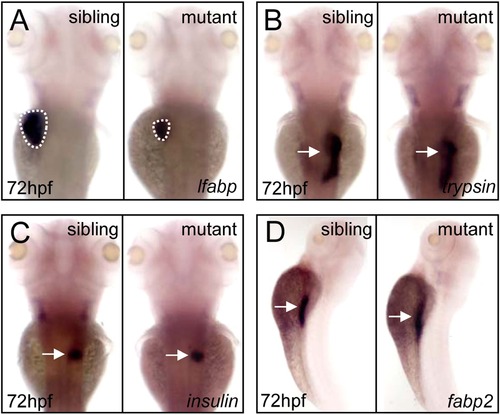
Disruption of cebpa gene reduces liver size. (A–D) WISH assay of lfabp (A), trypsin (B), insulin (C) and fabp2 (D) at 72 hpf, respectively. Dashed lines circle the boundary of the liver. (A–C), dorsal views, anterior to the top. (D) lateral view, dorsal to the right. EXPRESSION / LABELING:
PHENOTYPE:
|
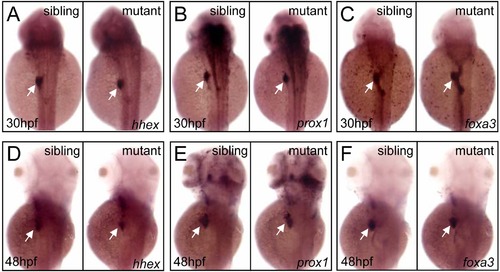
cebpa is dispensable for liver specification or budding. (A–F) WISH assay of hhex (A and D), prox1 (B and E) and foxa3 (C and F) at 30 and 48 hpf, respectively. (A–F), dorsal views, anterior to the top. White arrows indicate liver primordium. |
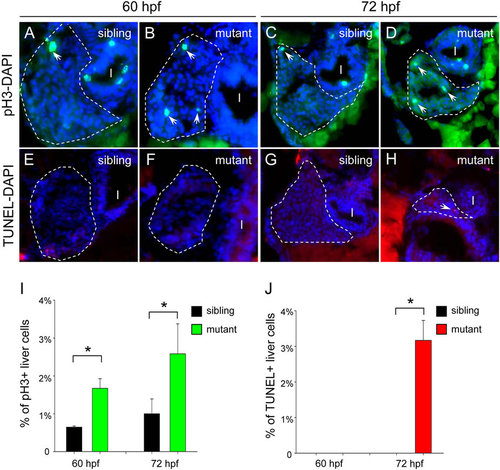
Loss of cebpa leads to enhanced hepatic cell proliferation and subsequent increased apoptosis. (A-H) Hepatic cell proliferation and apoptosis were determined by pH3 staining and TUNEL assay in 60 and 72 hpf embryos, respectively. The sections were counterstained with DAPI to label the nucleus. Dashed lines circle the boundary of the liver. White arrows indicate pH3 or TUNEL positive cells, respectively. In each case or at each time-point, more than 5 sections from at least three sibling control or cebpa mutant fish were examined. (I) intestine. (I,J) Quantification of hepatic cell proliferation and apoptosis, respectively. Data shown are the mean ± SD, n ≥ 3, *P < 0.05 by student’s t-test. PHENOTYPE:
|
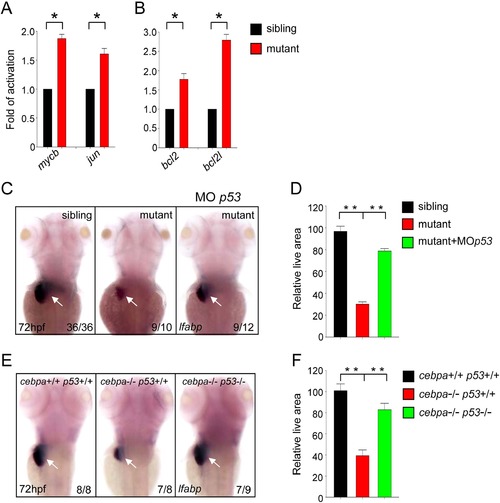
The p53 signaling pathway is activated in cebpa-deficient developing liver. (A–B) Quantitative PCR analysis of the expression of cell proliferation and apoptosis-related genes in 72 hpf embryos. Data shown are the mean ± SD, n e 3, *P < 0.05 by student’s t-test. (C,E) WISH assay of lfabp at 72 hpf. Loss of p53 could rescue the hepatic defect in cebpa mutant embryos. Dorsal views with anterior to the top. (D,F) The relative liver area measured in (C,E) respectively. The result shown is fold difference compared with the level (set to 100) detected in control embryos (mean ± SD, n e 3, **P < 0.005 by student’s t-test). EXPRESSION / LABELING:
PHENOTYPE:
|

cebpa is expressed in the developing liver. (A-C) WISH assay of cebpa from 24 to 48 hpf. White arrows indicate the liver-forming region. A-C, lateral views, dorsal to the right. A′-C′, dorsal views, anterior to the top. |
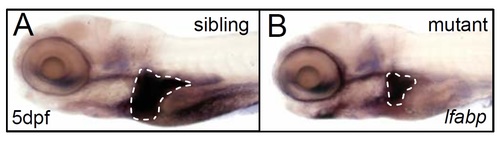
cebpa mutant embryos display a small liver phenotype. (A-B) WISH assay of lfabp at 5 dpf. Dashed lines circle the boundary of the liver. Lateral views, dorsal to the top. |