
- Title
-
Centriole Amplification in Zebrafish Affects Proliferation and Survival but Not Differentiation of Neural Progenitor Cells
- Authors
- Dzafic, E., Strzyz, P.J., Wilsch-Bräuninger, M., Norden, C.
- Source
- Full text @ Cell Rep.
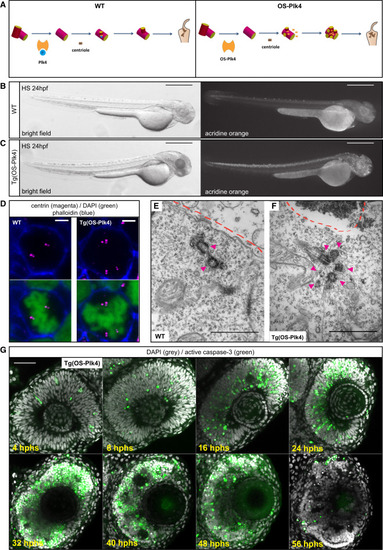
Expression of Overstabilized Plk4 in the Developing Zebrafish Induces Centriole Amplification and Subsequent Apoptosis (A) Centriole duplication pathway in WT (left) and centriole amplification by expression of HS-inducible OS-Plk4 (right). The blue circle indicates a phosphate group. In the WT scenario, Plk4 is autophosphorylated and then degraded, leading to centriole duplication and four centrioles. OS-Plk4 lacks the phosphodegron domain; thus, it is not autophosphorylated and not degraded, leading to centriole amplification and multiple centrioles. (B and C) A WT fish (B) and a transgenic (Tg)HS-OS-Plk4 fish (C). HS was applied at 24 hpf, and fish were imaged at 24 hphs/48 hpf and stained with acridine orange to label apoptotic cells. Left: bright field, right: acridine orange. Scale bars, 500 µm. (D) Confocal scans, en face, of a mitotic WT neuroepithelial cell (left) with two poles, each containing two centrin spots (magenta) and a mitotic HS-OS-Plk4 neuroepithelial cell (right) with three poles: one featuring three centrin spots and two containing two centrin spots (magenta). Merged with cell outlines (phalloidin, blue) and chromatin (DAPI, green). Scale bars, 5 µm. HS was applied at 24 hpf, and cells were fixed at 16 hphs. (E) EM image of a WT neuroepithelial cell showing two centrioles (magenta arrows). Dashed line marks the apical side. Scale bar, 1 µm. See Figure S1C for full series of sections. HS was applied at 24 hpf, and cells were fixed at 10 hphs. (F) EM image of a Tg(HS-OS-Plk4) neuroepithelial cell showing six centrioles (magenta arrows). Dashed line marks the apical side. Scale bar, 1 µm. HS was applied at 24 hpf, and cells were fixed at 10 hphs. (G) Time series of confocal scans of retinae of Tg(HS-OS-Plk4) fish. HS was applied at 24 hpf, and fish were stained for apoptotic marker active-caspase-3 (green) and DAPI (gray). Scale bar, 50 µm. See also Figures S1B–S1D. |

Centriole Amplification Induces Multipolar Anaphases but Bipolar Cytokinesis Generates Binucleated Progeny (A) Time-lapse images of a neuroepithelial cell in a Tg(HS-OS-Plk4) embryo with a bipolar anaphase. H2B-RFP labels chromatin, Ras-mKate2 labels cell outline (both green), and centrin-GFP labels centrosomes (magenta). The yellow arrows mark the position of amplified centrioles (magenta). Nuclei are highlighted with dots. Frames are from Movie S1. (B) Time-lapse images of a neuroepithelial cell in a Tg(HS-OS-Plk4) embryo with a multipolar anaphase. H2B-RFP labels chromatin, Ras-mKate2 labels cell outline (both green), and centrin-GFP labels centrosomes (magenta). The blue arrows mark the position of amplified centrioles (magenta). In the insets of the last frame. the daughter nuclei are shown in two different z planes to distinguish three separate nuclei. Nuclei are highlighted with dots. Frames are from Movie S1. (C) Time-lapse images of a neuroepithelial cell during cytokinesis in three different z planes in an embryo injected with HS-OS-Plk4, HS-H2B-RFP (chromatin, magenta), and HS-utrophin-GFP (F-actin, gray). Colored dots mark three daughter nuclei. Blue arrow marks a cytokinetic furrow that later regresses, and yellow arrows mark a cytokinetic furrow that divides three daughter nuclei into two cells. A mononucleated cell is marked with a white dot, and a binucleated cell is marked with a blue dot and a green dot. Frames are from Movie S2. For all panels: HS was applied at 24 hpf, and imaging started at 10 hphs. Scale bars, 5 µm. Time is given in minutes. See also Movies S1 and S2. |
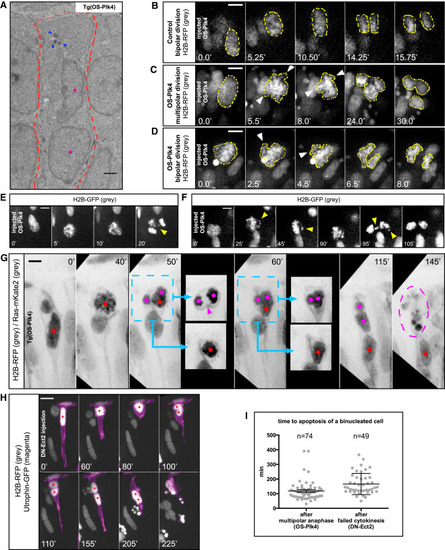
Upon Centriole Amplification, Cells Feature Genetic Material Distribution Defects at Mitosis, but Only the Generation of Binucleated Cells Triggers Apoptosis in Neuroepithelia (A) EM image of a binucleated cell in the neuroepithelium of a Tg(HS-OS-Plk4) embryo. Arrows show amplified centrioles, dots indicate both nuclei, and cell outline is highlighted with a dashed line. Scale bar, 1 µm. HS was applied at 24 hpf and cells were fixed at 10 hphs. (B) Time-lapse images of a neuroepithelial cell in a WT embryo exhibiting bipolar anaphase. HS-H2B-RFP labels chromatin (gray with yellow outlines). Frames are from Movie S3. HS was applied at 24 hpf, and imaging started at 14 hphs. (C–F) Time-lapse images of a neuroepithelial cell in an embryo injected with HS-OS-Plk4, exhibiting multipolar (C and E) or bipolar (D and F) anaphase. HS-H2B-RFP labels chromatin (gray with yellow outlines). Arrows mark chromatin bursts and lagging chromosomes. Frames are from Movie S3. HS was applied at 24 hpf, and imaging started at 14 hphs. (G) Time-lapse images of a neuroepithelial cell in a Tg(HS-OS-Plk4) embryo. H2B-RFP labels chromatin, and Ras-mKate2 labels cell outline (both in gray). A cell exhibits a multipolar anaphase. Colored dots mark three daughter nuclei. In the insets, the daughter nuclei are shown in two different z planes to distinguish a binucleated cell (magenta dots) and a mononucleated cell (red dot). Magenta arrow in the inset at time (t) = 50 min (50′) indicates a cytokinetic furrow that later regresses, resulting in the formation of a binucleated daughter. Dashed circle at t = 145′ marks apoptosis of the binucleated cell. Frames are from Movie S4. HS was applied at 24 hpf, and imaging started at 10 hphs. (H) Time-lapse images of a neuroepithelial cell in a WT embryo injected with HS-DN-Ect2. HS-H2B-RFP labels chromatin (gray), and HS-utrophin-GFP labels F-actin (magenta). The red dot marks a single nucleus before division and two nuclei in a respective cell after failed cytokinesis at t = 100′. The frames are from Movie S4. Scale bar, 10 µm. HS was applied at 32 hpf, and imaging started at 2 hphs. (I) Time between completion of division and apoptosis of binucleated cells. Analysis on WT embryos injected with HS-OS-Plk4 (multipolar anaphase) and HS-DN-Ect2 (failed cytokinesis). Each dot represents one binucleated cell that underwent apoptosis. Lines represent mean ± SEM. Scale bars, 5 µm unless otherwise stated. Time is given in minutes. See also Movies S3 and S4. |
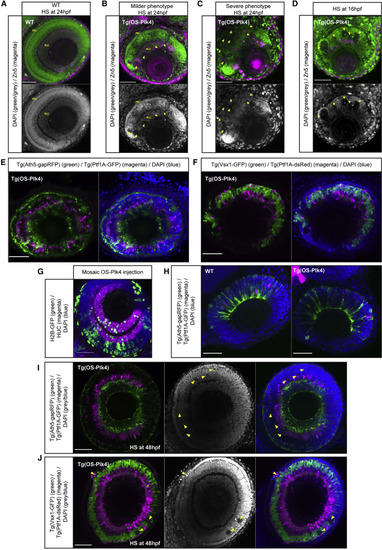
Centriole Amplification Affects the Proliferative Phase of Retinal Development but Not Neuronal Differentiation (A–C) Confocal scans of the retinae of control (A) and transgenic Tg(HS-OS-Plk4) fish (B and C) showing milder (B) or severe (C) phenotypes; HS was applied at 24 hpf, and these embryos were fixed at 80 hpf and stained for Zn-5 (retinal ganglion cells, or RGCs; magenta) and DAPI (nuclei, green/gray). Arrows label holes in nuclear arrangement. In fish with milder phenotype (B), some neuronal layering can be observed corresponding to RGC layer and photoreceptor cell (PRC) layer. (D) Confocal scan of the retina of a Tg(HS-OS-Plk4) fish; HS was applied at 16 hpf, and these embryos were fixed at 80 hpf and stained for Zn-5 (magenta) and DAPI (green/gray). Arrows label large holes in the tissue. (E) Confocal scan of the retina of Tg(HS-OS-Plk4) fish crossed to Tg(Ath5-gapRFP) (marker of early born neurons: RGCs and PRCs, green) and Tg(Ptf1A-GFP) (marker of later born neurons: amacrine and horizontal cells, magenta) line; HS was applied at 24 hpf, and these embryos were fixed at 76 hpf and stained for DAPI. (F) Confocal scan of the retina of Tg(HS-OS-Plk4) fish crossed to Tg(Vsx1-GFP) (marker of late-born bipolar cells, green) and Tg(Ptf1A-dsRed) (magenta) lines, HS was applied at 24 hpf, and these embryos were fixed at 96 hpf and stained for DAPI. (G) Confocal scan of the retina of fish injected with HS-OS-Plk4 construct and HS-H2B-GFP construct (labeling OS-Plk4-expressing cells, green); HS was applied at 24 hpf, and these embryos were fixed at 80 hpf and stained for HuC/D (RGCs and amacrine cell marker, magenta) and DAPI (blue). (H) Confocal scans of retinae from crosses of Tg(HS-OS-Plk4) fish to Tg(Ath5-gapRFP) (green) and Tg(Ptf1A-GFP) (magenta) lines (right panel) and Tg(Ath5-gapRFP) (green)/Tg(Ptf1A-GFP) (magenta) line only (control, left panel); HS was applied at 24 hpf, and these embryos were fixed at 50 hpf and stained for DAPI (blue). (I and J) Confocal scan of the retina of Tg(HS-OS-Plk4) fish crossed to the Tg(Ath5-gapRFP) (green)/Tg(Ptf1A-GFP) (magenta) line (I) or Tg(Vsx1-GFP) (green)/Tg(Ptf1A-dsRed) (magenta) line (J). HS was applied at 48 hpf, and these embryos were fixed at 78 hpf and stained for DAPI (gray/blue). Arrows point at smaller holes/apoptotic regions in the tissue. Scale bars, 50 µm. |

WT Cells Can Compensate for Apoptotic Cell Loss Resulting from Centriole Amplification (A and B) Confocal scans of the retina of a WT fish (A) and a fish injected with HS-OS-Plk4 and HS-H2B-GFP constructs (green) (B); HS was applied at 24 hpf, and these embryos were fixed at 80 hpf and stained for phospho-histone 3 (pH3) (mitotic cells, magenta) and DAPI (nuclei, blue). Arrows point at mitotic cells at ectopic positions. (C) Bright-field images of the eyes of Tg(HS-OS-Plk4) fish transplanted with WT cells. Scale bar, 100 µm. (D) Confocal scans of the retinae of fish following transplantation of WT cells, expressing Ras-GFP (gray) and HS-H2B-RFP (green). Left and middle panels show Tg(HS-OS-Plk4) fish depicted in (C). Right panel shows a WT transplanted fish (control); HS was applied at 24 hpf, and these embryos were fixed 2.5 days later (control)/4 days later in OS-Plk4 background to compensate for developmental delay and stained with DAPI (gray/magenta). Scale bars, 50 µm unless otherwise stated. See also Figure S7. |
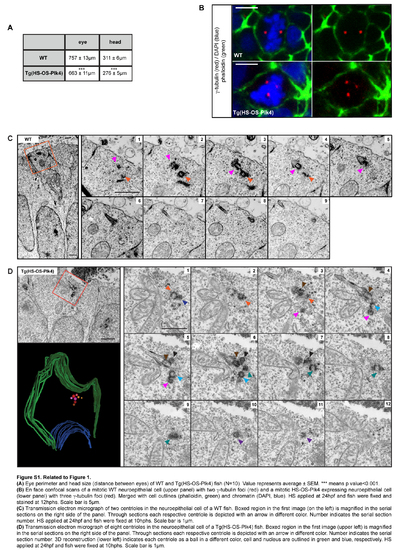
Related to Figure 1. (A) Eye perimeter and head size (distance between eyes) of wr and Tg(HS-OS-Plk4) fish (N=10). Value represents average± SEM. *** means p value<0.001. (B) En face confocal scans of a mitotic wr neuroepithelial cell (upper panel) with two y-tubulin foci (red) and a mitotic HS-OS-Plk4 expressing neuroepithelial cell (lower panel) with three y-tubulin foci (red). Merged with cell outlines {phalloidin, green) and chromatin (DAPI, blue). HS applied at 24hpf and fish were fixed and stained at 12hphs. Scale bar is 5µm. (C) Transmission electron micrograph of two centrioles in the neuroepithelial cell of a wr fish. Boxed region in the first image (on the left) is magnified in the serial sections on the right side of the panel. Through sections each respective centriole is depicted with an arrow in different color. Number indicates the serial section number. HS applied at 24hpf and fish were fixed at 1 0hphs. Scale bar is 1 µm. (D) Transmission electron micrograph of eight centrioles in the neuroepithelial cell of a Tg(HS-OS-Plk4) fish. Boxed region in the first image (upper left) is magnified in the serial sections on the right side of the panel. Through sections each respective centriole is depicted with an arrow in different color. Number indicates the serial section number. 3D reconstruction (lower left) indicates each centriole as a ball in a different color, cell and nucleus are outlined in green and blue, respectively. HS applied at 24hpf and fish were fixed at 1 0hphs. Scale bar is 1 µm. |

Related to Figure 1. (A) Centriole number quantification in interphase neuroepithelial cells in the WT and Tg(OS-Plk4) fish based on the EM data. HS applied at 24hpf and fish were fixed at 10hphs. (B) Centriole number quantification in mitotic neuroepithelial cells in the WT and Tg(OS-Plk4) fish obtained from en face imaging of centrin stained samples. HS applied at 24hpf and fish were fixed at 16hphs. (C) Summary of centriole number abnormalities observed in Tg(OS-Plk4) mitotic cells, fixed at 16hphs and imaged en face following centrin antibody staining. Percentage of total number of cells counted for each category as well as in the overlap between categories is shown. (D) Graphs showing the spread of centriole numbers within single embryos obtained from EM analysis (top) and IF analysis (bottom). (E) Confocal scans of retinae of WT fish injected with HS-OS-Plk4 at different timepoints after HS applied at 24hpf, stained for active-caspase-3 (apoptotic marker, green) and DAPI (grey). Scale bar is 50μm. (F) Confocal scans of retinae of WT control fish at different timepoints after HS applied at 24hpf, stained for active-caspase-3 (apoptotic marker, green) and DAPI (grey). Scale bar is 50μm. |

Related to Figure 2. (A) Transmission electron micrograph of a mitotic neuroepithelial cell in telophase in a Tg(HSOS-Plk4) fish showing unbalanced spindle poles. HS applied at 24hpf and fish were fixed at 1 0hphs. Magenta-boxed region in the left image indicates a left spindle pole and is magnified in the serial sections in (B). Yellow-boxed region in the right image indicated a right spindle pole and is magnified in the serial sections in (C). Scale bar is 1µm. (B) Magnified image (left panel in A) is showing two centrioles in the serial sections. Through sections each respective centriole is depicted with an arrow in a different color. Number indicates a serial section number. Scale bar is 0.1 µm. (C) Magnified image from (right panel in A) is showing three centrioles in the serial sections. Through sections each respective centriole is depicted with an arrow in a different color. Number indicates a serial section number. Scale bar is 0.1 µm. (D) 3D reconstruction of unbalanced spindle poles in a mitotic neuroepithelial cell shown in (A). Each centriole is a ball in a different color, cell and nucleus are outlined in green and blue, respectively. |
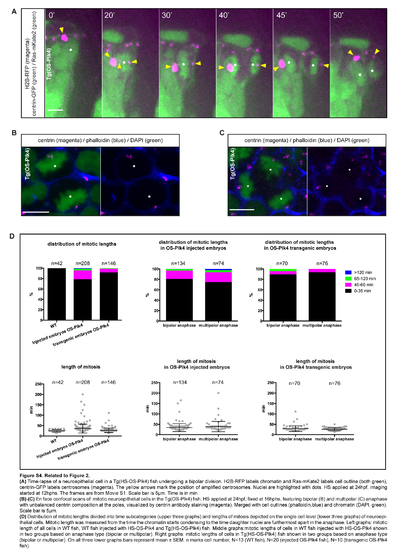
Related to Figure 2. (A) Time-lapse of a neuroepithelial cell in a Tg(HS-OS-Plk4) fish undergoing a bipolar division. H2B-RFP labels chromatin and Ras-mKate2 labels cell outline (both green), centrin-GFP labels centrosomes (magenta). The yellow arrows mark the position of amplified centrosomes. Nuclei are highlighted with dots. HS applied at 24hpf, imaging started at 12hphs. The frames are from Movie S1. Scale bar is 5µm. Time is in min. (B)-(C) En face confocal scans of mitotic neuroepithelial cells in the Tg(OS-Plk4) fish, HS applied at 24hpf, fixed at 16hphs, featuring bipolar (B) and multipolar (C) anaphase with unbalanced centrin composition at the poles, visualized by centrin antibody staining (magenta). Merged with cell outlines (phalloidin,blue) and chromatin (DAPI, green). Scale bar is 5µm. (D) Distribution of mitotic lengths divided into time subcategories (upper three graphs) and lengths of mitosis depicted on the single cell level (lower three graphs) of neuroepithelial cells. Mitotic length was measured from the time the chromatin starts condensing to the time daughter nuclei are furthermost apart in the anaphase. Left graphs: mitotic length of all cells in wr fish, wr fish injected with HS-OS-Plk4 and Tg(HS-OS-Plk4) fish. Middle graphs:mitotic lengths of cells in wr fish injected with HS-OS-Plk4 shown in two groups based on anaphase type (bipolar or multipolar). Right graphs: mitotic lengths of cells in Tg(HS-OS-Plk4) fish shown in two groups based on anaphase type (bipolar or multipolar). On all three lower graphs bars represent mean± SEM. n marks cell number, N=13 (WT fish), N=20 (injected OS-Plk4 fish), N=10 (transgenic OS-Plk4 fish) |
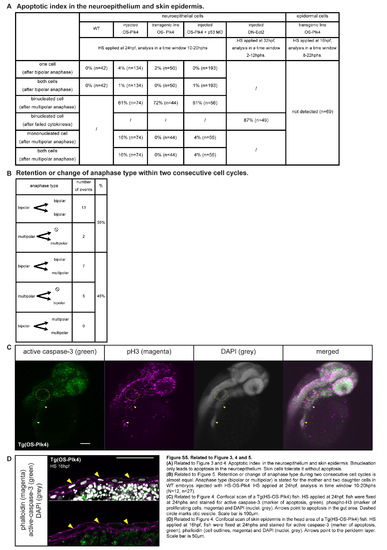
Related to Figure 3, 4 and 5. (A) Related to Figure 3 and 4. Apoptotic index in the neuroepithelium and skin epidermis. Binucleation only leads to apoptosis in the neuroepithelium. Skin cells tolerate it without apoptosis. (B) Related to Figure 5. Retention or change of anaphase type during two consecutive cell cycles is almost equal. Anaphase type (bipolar or multipolar) is stated for the mother and two daughter cells in wr embryos injected with HS-OS-Plk4. HS applied at 24hpf, analysis in time window 10-20hphs (N=12, n=27). (C) Related to Figure 4. Confocal scan of a Tg(HS-OS-Plk4) fish. HS applied at 24hpf, fish were fixed at 24hphs and stained for active caspase-3 (marker of apoptosis, green), phospho-H3 (marker of proliferating cells, magenta) and DAPI (nuclei, grey). Arrows point to apoptosis in the gut area. Dashed circle marks otic vesicle. Scale bar is 1 00µm. (D) Related to Figure 4. Confocal scan of skin epidermis in the head area of a Tg(HS-OS-Plk4) fish. HS applied at 16hpf, fish were fixed at 24hphs and stained for active caspase-3 (marker of apoptosis, green), phalloidin (cell outlines, magenta) and DAPI (nuclei, grey). Arrows point to the periderm layer. Scale bar is 50µm. |

Related to Figure 6. (A) Transmission electron micrographs showing a pair of centrioles in post-mitotic retinal neuron of a wr fish. HS applied at 24hpf and fish were fixed at 50hpf. Boxed region in the first image (on the left) is magnified in the serial sections on the right side of the panel. Through sections each respective centriole is depicted with an arrow in a different color. Number indicates the serial section number. (B) Transmission electron micrographs showing four centrioles in post-mitotic retinal neuron of a Tg(HS-OS-Plk4) fish. HS applied at 24hpf and fish were fixed at 62hpf. Boxed region in the first image (on the left) is magnified in the serial sections on the right side of the panel. Note black bodies marking significant apoptosis. Through sections each respective centriole is depicted with an arrow in a different color. Number indicates the serial section number. Scale bars are 1 µm. |

Related to Figure 7. (A)-(B) Bright field images of eyes ofTg(HS-OS-Plk4) fish transplanted with wild type cells, showing big disproportion in size between the eyes. Scale bars are 100µm. (C) Confocal scans of retinae of fish following transplantation of WT cells, expressing Ras-GFP (grey) and HS-H2B-RFP (green). Top and middle panels show Tg(HS-OS-Plk4) fish depicted in (A). Bottom panel shows a WT, transplanted fish (control). HS applied at 24hpf, fish were fixed 2.5 days later (control)/ 4 days later (in OS-Plk4 background to compensate for significant developmental abnormalities causing delay) and stained with DAPI (grey/magenta). In the HS-OS-Plk4 background WT cells repopulate the tissue and substantially restore neuronal lamination (top panel). Contralateral eye shows very few transplanted WT cells and displays significant tissue disorganization (middle panel). In control, distinct, separated clones of transplanted cells are present (bottom panel). (D) Confocal scans of retinae of fish following transplantation of WT cells, expressing Ras-GFP (grey) and HS-H2B-RFP (green). Top and middle panels show Tg(HS-OS-Plk4) fish depicted in (B). Bottom panel shows a WT, transplanted fish (control). HS applied at 24hpf, fish were fixed 2.5 days later and stained with DAPI (grey/magenta). In the HS-OS-Plk4 background WT cells repopulate the tissue and substantially restore neuronal lamination (top panel). Contralateral eye shows very few transplanted WT cells and displays significant tissue disorganization (middle panel). In control, distinct, separated clones of transplanted cells are present (bottom panel). All scale bars are 50µm unless stated otherwise. |