
|
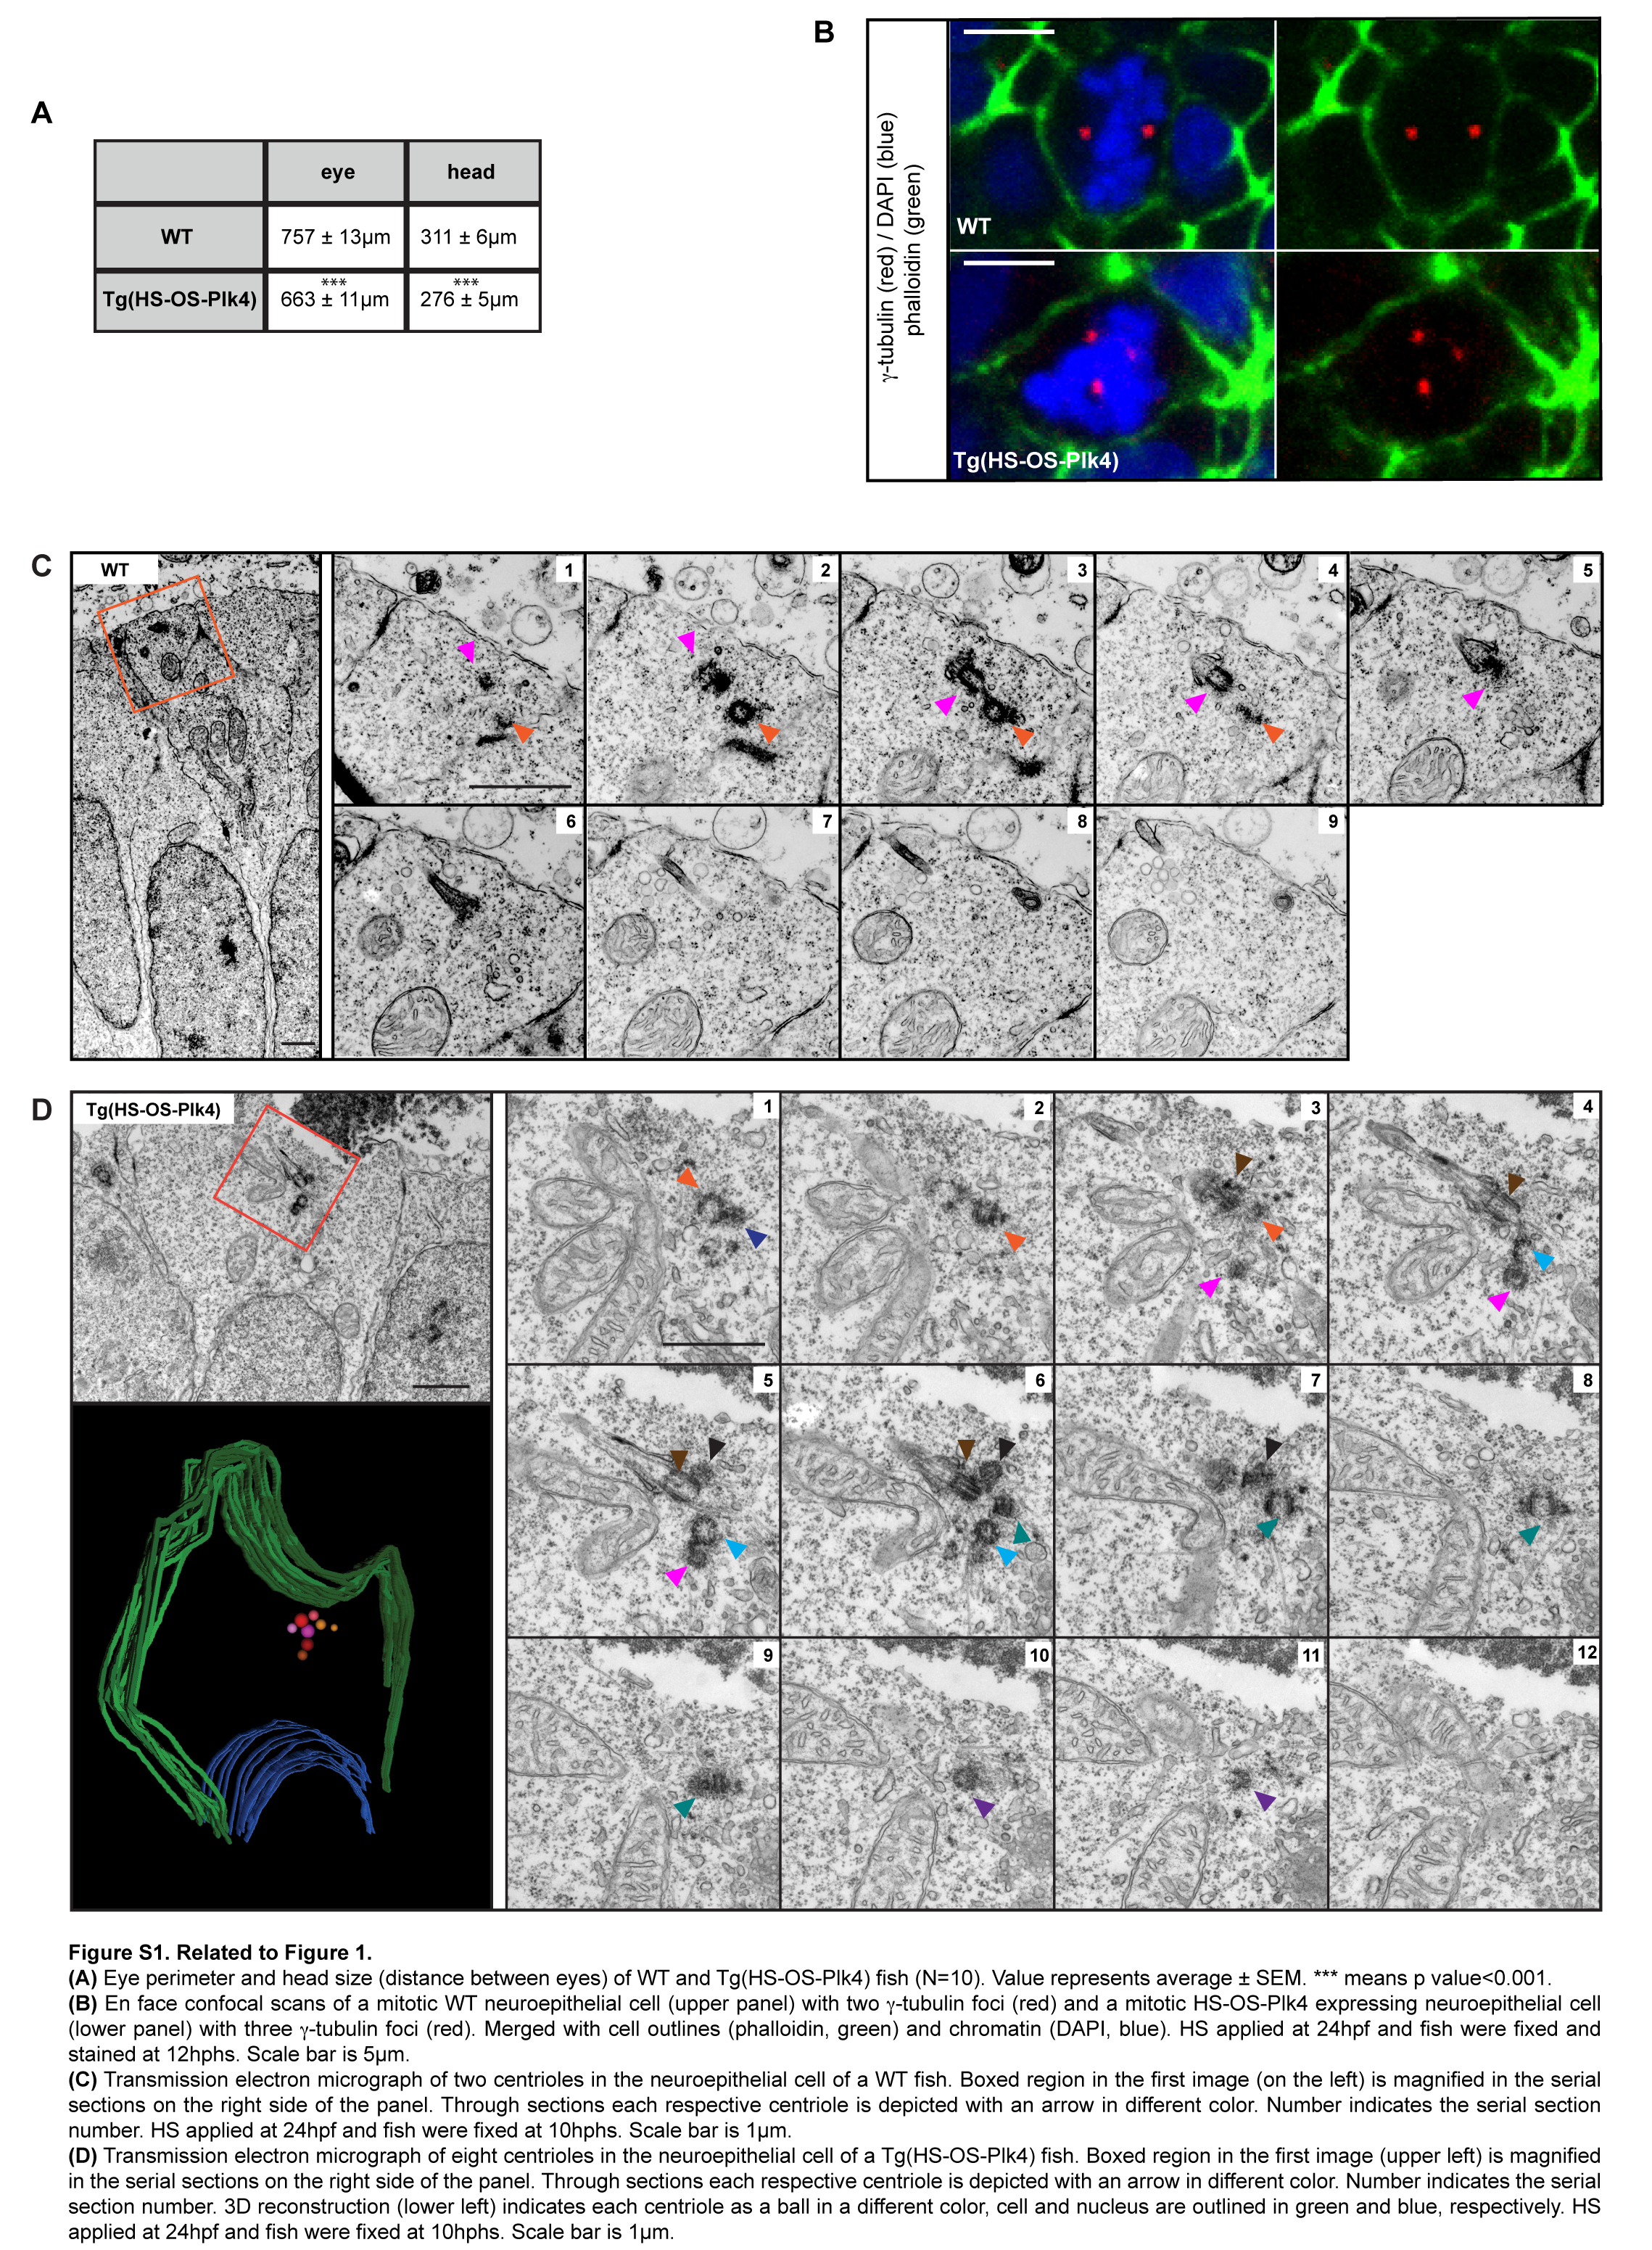
Fig. S1
Related to Figure 1.
(A) Eye perimeter and head size (distance between eyes) of wr and Tg(HS-OS-Plk4) fish (N=10). Value represents average± SEM. *** means p value<0.001.
(B) En face confocal scans of a mitotic wr neuroepithelial cell (upper panel) with two y-tubulin foci (red) and a mitotic HS-OS-Plk4 expressing neuroepithelial cell (lower panel) with three y-tubulin foci (red). Merged with cell outlines {phalloidin, green) and chromatin (DAPI, blue). HS applied at 24hpf and fish were fixed and stained at 12hphs. Scale bar is 5µm.
(C) Transmission electron micrograph of two centrioles in the neuroepithelial cell of a wr fish. Boxed region in the first image (on the left) is magnified in the serial sections on the right side of the panel. Through sections each respective centriole is depicted with an arrow in different color. Number indicates the serial section number. HS applied at 24hpf and fish were fixed at 1 0hphs. Scale bar is 1 µm.
(D) Transmission electron micrograph of eight centrioles in the neuroepithelial cell of a Tg(HS-OS-Plk4) fish. Boxed region in the first image (upper left) is magnified in the serial sections on the right side of the panel. Through sections each respective centriole is depicted with an arrow in different color. Number indicates the serial section number. 3D reconstruction (lower left) indicates each centriole as a ball in a different color, cell and nucleus are outlined in green and blue, respectively. HS applied at 24hpf and fish were fixed at 1 0hphs. Scale bar is 1 µm.