
Fig. 3
- ID
- ZDB-FIG-151120-23
- Publication
- Dzafic et al., 2015 - Centriole Amplification in Zebrafish Affects Proliferation and Survival but Not Differentiation of Neural Progenitor Cells
- Other Figures
- All Figure Page
- Back to All Figure Page
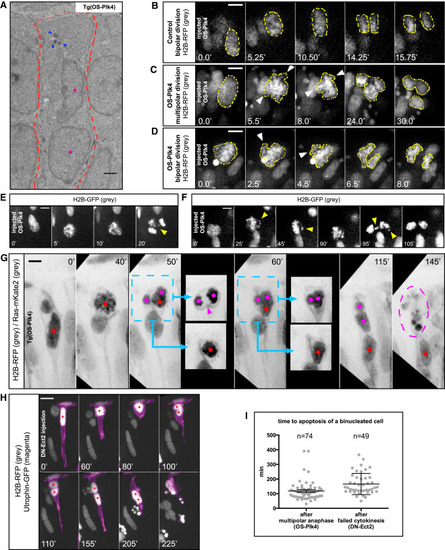
Upon Centriole Amplification, Cells Feature Genetic Material Distribution Defects at Mitosis, but Only the Generation of Binucleated Cells Triggers Apoptosis in Neuroepithelia (A) EM image of a binucleated cell in the neuroepithelium of a Tg(HS-OS-Plk4) embryo. Arrows show amplified centrioles, dots indicate both nuclei, and cell outline is highlighted with a dashed line. Scale bar, 1 µm. HS was applied at 24 hpf and cells were fixed at 10 hphs. (B) Time-lapse images of a neuroepithelial cell in a WT embryo exhibiting bipolar anaphase. HS-H2B-RFP labels chromatin (gray with yellow outlines). Frames are from Movie S3. HS was applied at 24 hpf, and imaging started at 14 hphs. (C–F) Time-lapse images of a neuroepithelial cell in an embryo injected with HS-OS-Plk4, exhibiting multipolar (C and E) or bipolar (D and F) anaphase. HS-H2B-RFP labels chromatin (gray with yellow outlines). Arrows mark chromatin bursts and lagging chromosomes. Frames are from Movie S3. HS was applied at 24 hpf, and imaging started at 14 hphs. (G) Time-lapse images of a neuroepithelial cell in a Tg(HS-OS-Plk4) embryo. H2B-RFP labels chromatin, and Ras-mKate2 labels cell outline (both in gray). A cell exhibits a multipolar anaphase. Colored dots mark three daughter nuclei. In the insets, the daughter nuclei are shown in two different z planes to distinguish a binucleated cell (magenta dots) and a mononucleated cell (red dot). Magenta arrow in the inset at time (t) = 50 min (50′) indicates a cytokinetic furrow that later regresses, resulting in the formation of a binucleated daughter. Dashed circle at t = 145′ marks apoptosis of the binucleated cell. Frames are from Movie S4. HS was applied at 24 hpf, and imaging started at 10 hphs. (H) Time-lapse images of a neuroepithelial cell in a WT embryo injected with HS-DN-Ect2. HS-H2B-RFP labels chromatin (gray), and HS-utrophin-GFP labels F-actin (magenta). The red dot marks a single nucleus before division and two nuclei in a respective cell after failed cytokinesis at t = 100′. The frames are from Movie S4. Scale bar, 10 µm. HS was applied at 32 hpf, and imaging started at 2 hphs. (I) Time between completion of division and apoptosis of binucleated cells. Analysis on WT embryos injected with HS-OS-Plk4 (multipolar anaphase) and HS-DN-Ect2 (failed cytokinesis). Each dot represents one binucleated cell that underwent apoptosis. Lines represent mean ± SEM. Scale bars, 5 µm unless otherwise stated. Time is given in minutes. See also Movies S3 and S4. |