
Fig. 1
- ID
- ZDB-FIG-151120-21
- Publication
- Dzafic et al., 2015 - Centriole Amplification in Zebrafish Affects Proliferation and Survival but Not Differentiation of Neural Progenitor Cells
- Other Figures
- All Figure Page
- Back to All Figure Page
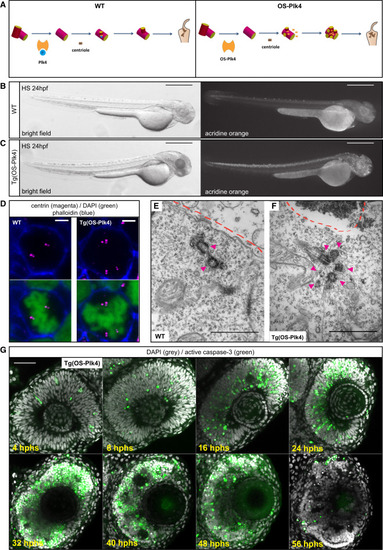
Expression of Overstabilized Plk4 in the Developing Zebrafish Induces Centriole Amplification and Subsequent Apoptosis (A) Centriole duplication pathway in WT (left) and centriole amplification by expression of HS-inducible OS-Plk4 (right). The blue circle indicates a phosphate group. In the WT scenario, Plk4 is autophosphorylated and then degraded, leading to centriole duplication and four centrioles. OS-Plk4 lacks the phosphodegron domain; thus, it is not autophosphorylated and not degraded, leading to centriole amplification and multiple centrioles. (B and C) A WT fish (B) and a transgenic (Tg)HS-OS-Plk4 fish (C). HS was applied at 24 hpf, and fish were imaged at 24 hphs/48 hpf and stained with acridine orange to label apoptotic cells. Left: bright field, right: acridine orange. Scale bars, 500 µm. (D) Confocal scans, en face, of a mitotic WT neuroepithelial cell (left) with two poles, each containing two centrin spots (magenta) and a mitotic HS-OS-Plk4 neuroepithelial cell (right) with three poles: one featuring three centrin spots and two containing two centrin spots (magenta). Merged with cell outlines (phalloidin, blue) and chromatin (DAPI, green). Scale bars, 5 µm. HS was applied at 24 hpf, and cells were fixed at 16 hphs. (E) EM image of a WT neuroepithelial cell showing two centrioles (magenta arrows). Dashed line marks the apical side. Scale bar, 1 µm. See Figure S1C for full series of sections. HS was applied at 24 hpf, and cells were fixed at 10 hphs. (F) EM image of a Tg(HS-OS-Plk4) neuroepithelial cell showing six centrioles (magenta arrows). Dashed line marks the apical side. Scale bar, 1 µm. HS was applied at 24 hpf, and cells were fixed at 10 hphs. (G) Time series of confocal scans of retinae of Tg(HS-OS-Plk4) fish. HS was applied at 24 hpf, and fish were stained for apoptotic marker active-caspase-3 (green) and DAPI (gray). Scale bar, 50 µm. See also Figures S1B–S1D. |