
- Title
-
γ-tubulin is differentially expressed in mitotic and non-mitotic cardiomyocytes in the regenerating zebrafish heart
- Authors
- Sallin, P., Jaźwińska, A.
- Source
- Full text @ Data Brief
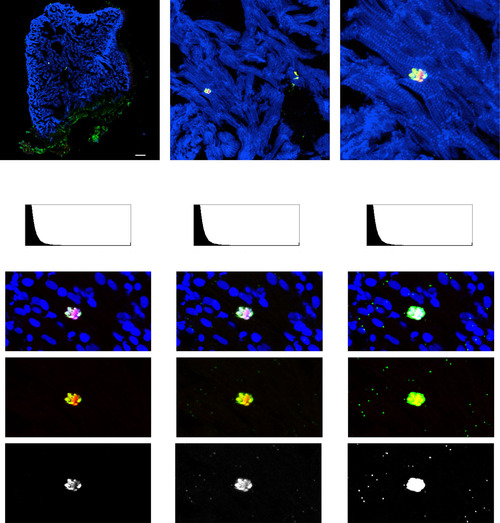
γ-tubulin is differentially distributed in mitotic and non-mitotic zebrafish cardiac cells. (A) Heart section of cmlc2::EGFP transgenic zebrafish at 14 days post cryoinjury (dpci) labeled with antibodies against GFP (cmlc2: EGFP, anti-GFP, cardiac cells, blue), phospho-(Ser10)-histone H3 (PH3, mitosis, red) and γ-tubulin (centrosomes, spindle apparatus, green). Cryoinjured part is encircled with a dashed line. (B, C) Higher magnification of the framed area shown in (A) showing a PH3-positive cardiomyocyte (C). (D–F) The same area as in (C) but contrastained with DAPI (blue), which colocalizes with PH3 (condensed chromosomes) and γ-tubulin immunolabeling. (E) Original confocal image. (D) The fluorescence signal of γ-tubulin was optimized to display the localization in the mitotic spindle. Using this setting, γ-tubulin expression in the centrosomes of the non-mitotic cells is undetectable. (F) Image adjustments according to the non-mitotic cell to detect the dotty pattern of centrosomal expression. Note, an overexposed γ-tubulin labeling of the mitotic cell. Scale bar (A, B, and C)=50 µm; S= shadows; M= midtones; H= highlights. EXPRESSION / LABELING:
|
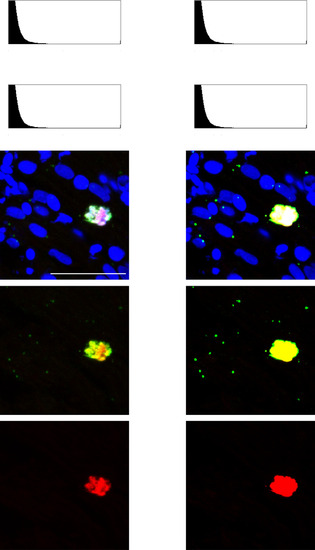
Dotty expression of γ-tubulin at the non-mitotic nuclei does not derive from enhanced background. (A) Higher magnification of the framed area shown in Fig.1 C labeled with PH3, γ-tubulin and DAPI. (B) The simultaneous increase of the green and red input levels reveals the dotty pattern of only γ-tubulin (green) but not PH3 (red). This demonstrates the specificity of green immunofluorescence consistent with the centrosomal localization of γ-tubulin. Scale bar (A)=25 µm; S=shadows; M=midtones; H=highlights. EXPRESSION / LABELING:
|
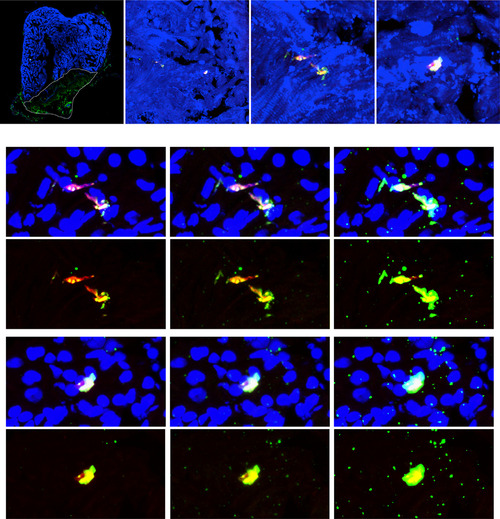
Additional examples of differential γ-tubulin expression in mitotic and non-mitotic cells. (A) Heart section of cmlc2::EGFP transgenic zebrafish at 14 days post cryoinjury (dpci) labeled with antibodies against GFP (cmlc2::EGFP, anti-GFP, cardiac cells, blue), phospho-(Ser10)-histone H3 (PH3, mitosis, red) and γ-tubulin (centrosomes, spindle apparatus, green). Cryoinjured part is encircled with a dashed line. (B) Higher magnification of the framed area shown in (A). (C, D) Higher magnification of the framed areas shown in (B) showing different PH3-positive cells. (C′, D′) The same areas as in (C) and (D) but contrastained with DAPI (blue). The differential subcellular expression of γ-tubulin in mitotic and non-mitotic cells was observed in several regions of each heart. N=5 hearts; Scale bar (A, B, C, C′)=50 µm; S=shadows; M= midtones; H=highlights. EXPRESSION / LABELING:
|