
Image
|
Figure Caption
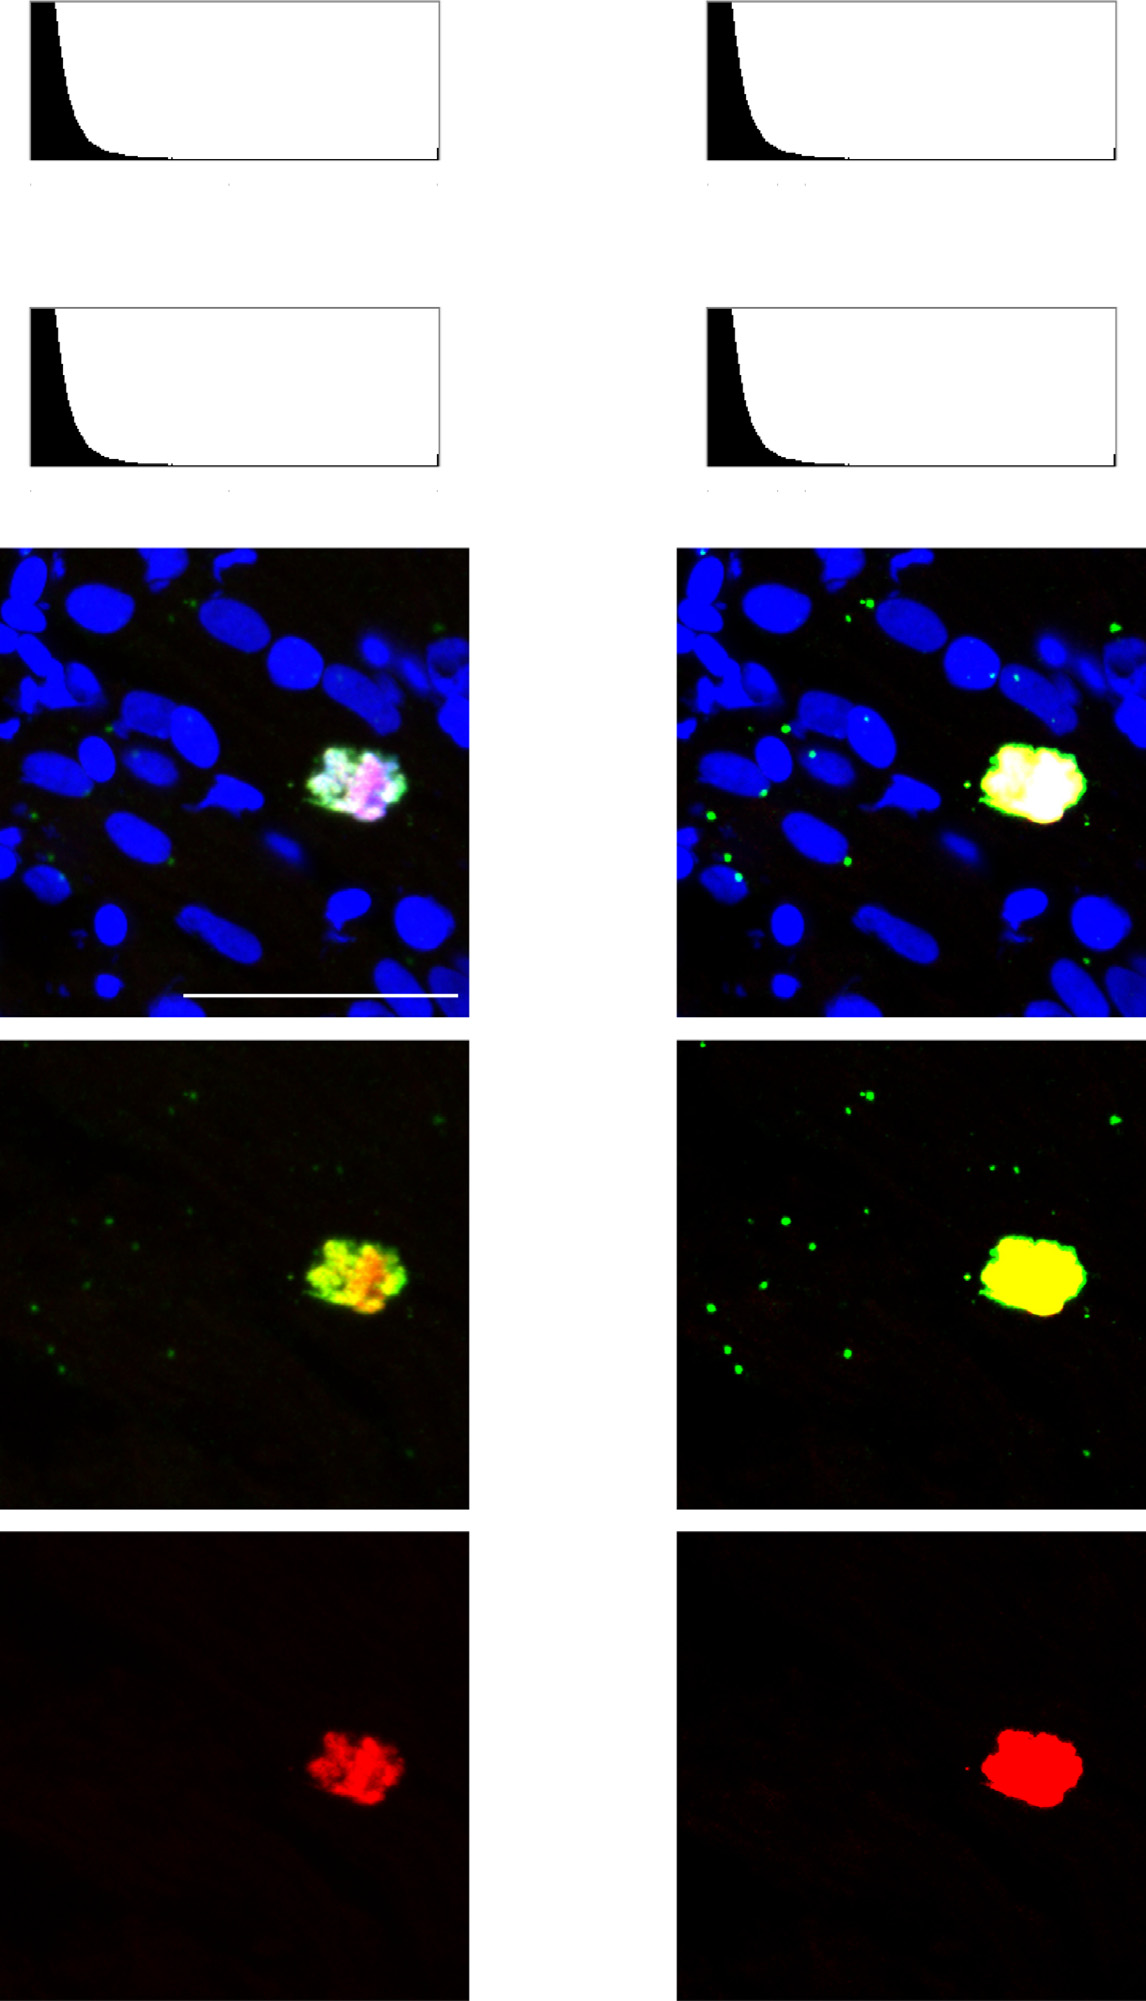
Fig. 2
Dotty expression of γ-tubulin at the non-mitotic nuclei does not derive from enhanced background. (A) Higher magnification of the framed area shown in Fig.1 C labeled with PH3, γ-tubulin and DAPI. (B) The simultaneous increase of the green and red input levels reveals the dotty pattern of only γ-tubulin (green) but not PH3 (red). This demonstrates the specificity of green immunofluorescence consistent with the centrosomal localization of γ-tubulin. Scale bar (A)=25 µm; S=shadows; M=midtones; H=highlights.
Figure Data
Acknowledgments
This image is the copyrighted work of the attributed author or publisher, and
ZFIN has permission only to display this image to its users.
Additional permissions should be obtained from the applicable author or publisher of the image.
Full text @ Data Brief