
|
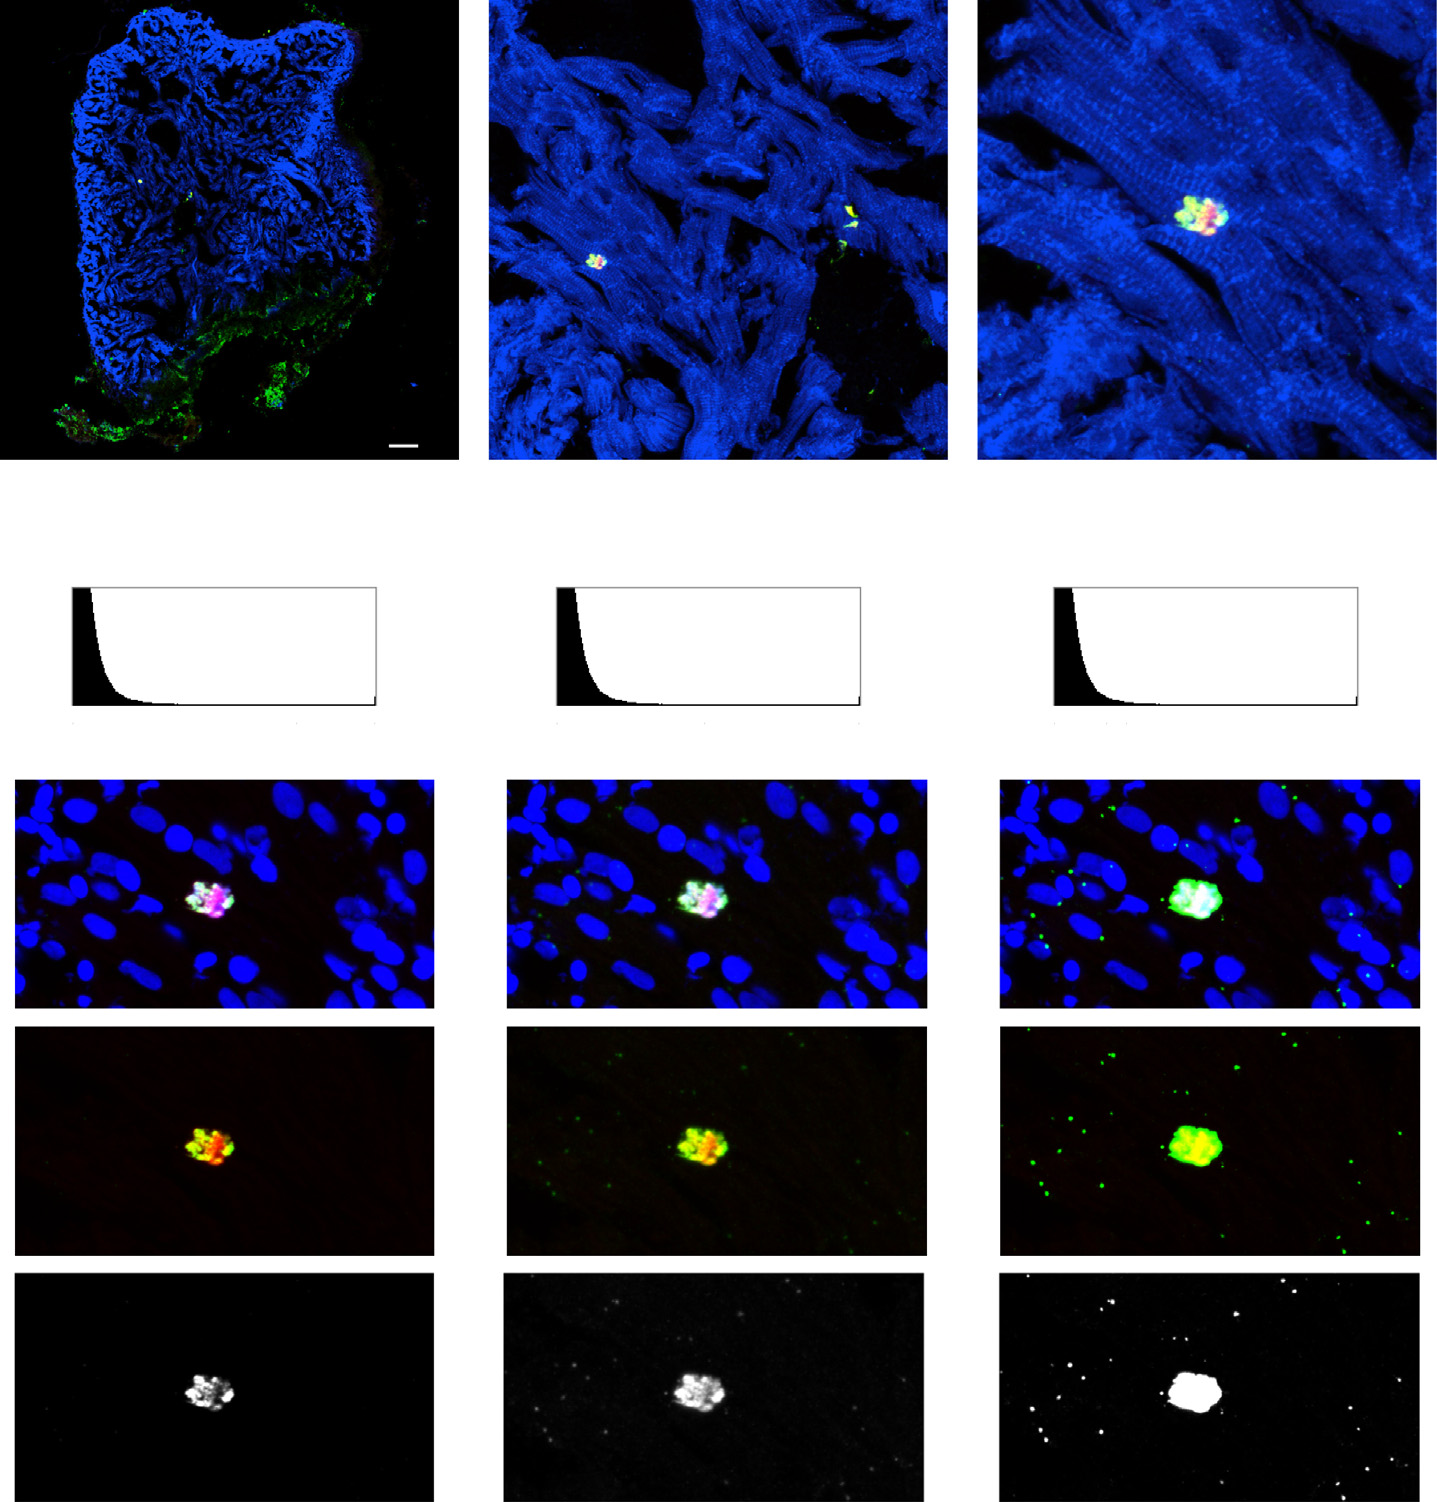
Fig. 1
γ-tubulin is differentially distributed in mitotic and non-mitotic zebrafish cardiac cells. (A) Heart section of cmlc2::EGFP transgenic zebrafish at 14 days post cryoinjury (dpci) labeled with antibodies against GFP (cmlc2: EGFP, anti-GFP, cardiac cells, blue), phospho-(Ser10)-histone H3 (PH3, mitosis, red) and γ-tubulin (centrosomes, spindle apparatus, green). Cryoinjured part is encircled with a dashed line. (B, C) Higher magnification of the framed area shown in (A) showing a PH3-positive cardiomyocyte (C). (D–F) The same area as in (C) but contrastained with DAPI (blue), which colocalizes with PH3 (condensed chromosomes) and γ-tubulin immunolabeling. (E) Original confocal image. (D) The fluorescence signal of γ-tubulin was optimized to display the localization in the mitotic spindle. Using this setting, γ-tubulin expression in the centrosomes of the non-mitotic cells is undetectable. (F) Image adjustments according to the non-mitotic cell to detect the dotty pattern of centrosomal expression. Note, an overexposed γ-tubulin labeling of the mitotic cell. Scale bar (A, B, and C)=50 µm; S= shadows; M= midtones; H= highlights.