
- Title
-
A Dicer-miR-107 Interaction Regulates Biogenesis of Specific miRNAs Crucial for Neurogenesis
- Authors
- Ristori, E., Lopez-Ramirez, M.A., Narayanan, A., Hill-Teran, G., Moro, A., Calvo, C.F., Thomas, J.L., Nicoli, S.
- Source
- Full text @ Dev. Cell
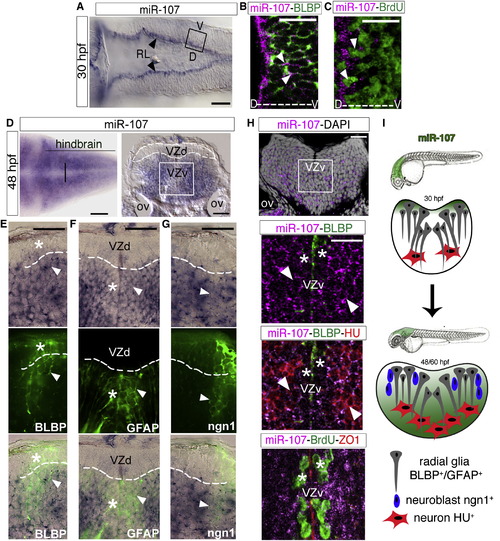
miR-107 Is Expressed in Newborn Neurons and Neural/Neuronal Progenitors across the Hindbrain Periventricular Zone (A) Expression of miR-107 at 30hpf is restricted to the RL (arrowheads). Dorsal is up and anterior to the left (B and C) Whole-mount confocal images of the boxed area in (A), stained with miR-107 LNA probe and anti-BLBP antibody in (B) or anti-BrdU antibody in (C). Brain orientation is indicated as D (dorsal) and V (ventral). Arrowheads indicate miR-107 expression. (D–H) Expression of miR-107 across the hindbrain of 48 hpf embryos. (D) Bright-field images of whole-mount embryos (left) and hindbrain transverse section (right). VZd indicates the dorsal ventricular hindbrain zone (white dotted line). VZv indicates ventral ventricular hindbrain zone (white solid square). (E–G) High-magnification images (60×) of the VZd zone representative of the region highlighted in (D) (left). miR-107 and protein colocalization is indicated with arrowheads, while miR-107 negative or low expressing cells are indicated with stars. (H) (Top) A confocal image of a transverse hindbrain section at the level of the otic vesicle (OV). miR-107 is shown in purple, and DAPI nuclei are in white. Stars indicate miR-107 expression in the ventral ventricular zone (VZv). (Bottom) coronal confocal sections at the VZv level highlighted by the white box in the top and stained for the indicated proteins. ZO1 staining indicates the apical region of the VZv where BrdU-positive cells are nested (white stars). (I) Schematic representation of the dynamic expression of miR-107 (green) in the developing hindbrain from 30 to 48/60 hpf. Scale bars represent 50 µm. |
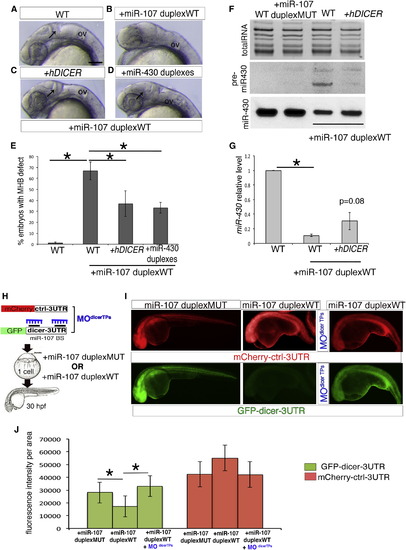
miR-107 Posttranscriptionally Regulates Dicer during Neural Development (A–D) Lateral view of 24 hpf zebrafish embryos treated as indicated. Anterior is to the left. Black arrows indicate MHB in (A), (C), and (D). (E) Percentage of embryos without MHB observed in (A–D). Data are presented as mean ± SEM of five independent experiments (n ~20 embryos each), p < 0.05. (F) Northern Blot showing miR-430 biogenesis in 24 hpf embryos treated as indicated. WT (uninjected embryos) and miR-107-duplex-MUT were used as controls. The image is representative of two independent experiments. (G) qRT-PCR of miR-430 levels in 24 hpf embryos treated as indicated. Levels are relative to the WT control. Data are mean ± SEM (n = 4). p < 0.05. (H) Schematic representation of the miR-107 sensor assay shown in (I–J). (I) Fluorescent images of whole-mount zebrafish embryos at 24 hpf treated as indicated. Anterior is to the left. (J) Quantification of GFP and mCherry fluorescence levels in each experimental condition measured as fluorescence intensity per area. Data are presented as mean ± SD of three independent experiments (n = 5 to 10 embryos each). p < 0.05. Scale bars represent 50 µm. OV, otic vesicle. |
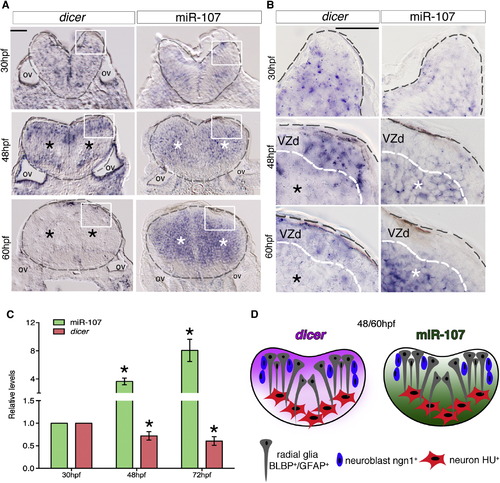
miR-107 and Dicer Show an Opposite Expression Pattern along the Hindbrain Ventricular Zone (A and B) Expression of dicer and miR-107 in 15 µm hindbrain cross-sections at 30, 48, and 60 hpf. Gray dashed line indicates the hindbrain area; black stars indicate the area with low dicer expression, while white stars show the region of high miR-107 expression. (B) High-magnification pictures (60×) of the region boxed in (A). (C) qRT-PCR of dicer and miR-107 levels at 30, 48, and 72 hpf and relative to the expression levels at 30 hpf. Data are presented as mean ± SEM of three independent experiments (n <20 embryos each). p < 0.05. (D) Graphic representation of the opposite spatial expression of dicer (purple) and miR-107 (green) in the hindbrain from 48 to 60 hpf. Scale bars represent 50 µm. EXPRESSION / LABELING:
|
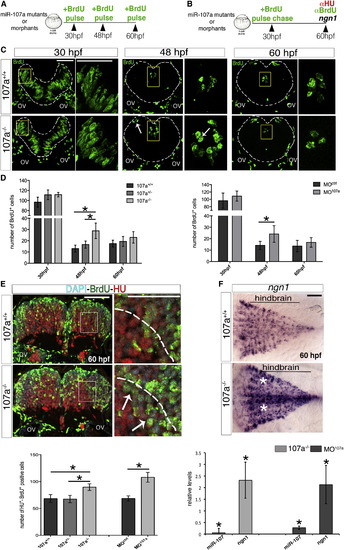
Loss of miR-107 Function Promotes Embryonic Hindbrain Neurogenesis (A and B) Schematic representation of the experiments in (C and D) and (E), respectively. (C) Hindbrain cross-sections showing brief BrdU pulse labeling of miR-107a+/+ and miR-107a-/- mutants at 30, 48, and 60 hpf. (Right) High magnifications of the area boxed in the left. White arrows indicate supernumerary BrdU+ cells. Gray dashed line indicates the hindbrain area. (D) Number of BrdU+ cells per section in (C) and in the MO107a- and MOctrl-injected embryos treated in the same conditions. Data are shown as mean ± SEM of two independent experiments for miR-107a mutants and three for the morphants (n = 5 to 10 embryos each). p < 0.05. (E) (Top) Hindbrain cross-sections of 60 hpf miR-107a+/+ and miR-107a-/- mutants stained for BrdU and HU. (Right) High magnifications of the boxed area in the left. Arrows indicate the increase of BrdU-HU double-positive cells migrating in the mantle area (dashed line). (Bottom) The quantification of the number of BrdU-HU double-positive cells in the indicated samples. Data are shown as mean ± SEM of two independent experiments for miR-107a mutants and three for morpholino (n = 5 to 10 embryos each). p < 0.05. (F) Expression of ngn1 in 107a+/+ and 107a-/- mutants at 60 hpf. Dorsal is up, and anterior is to the left. White stars indicate increased ngn1 staining. The graph shows the quantification by qRT-PCR of miR-107 and ngn1 expression levels in 107a mutants and in MO107a-injected embryos. Levels are relative to the respective controls (107a-/- and MOctrl, respectively). Data are shown as mean ± SEM. p < 0.05. Scale bars represent 50 µm. |
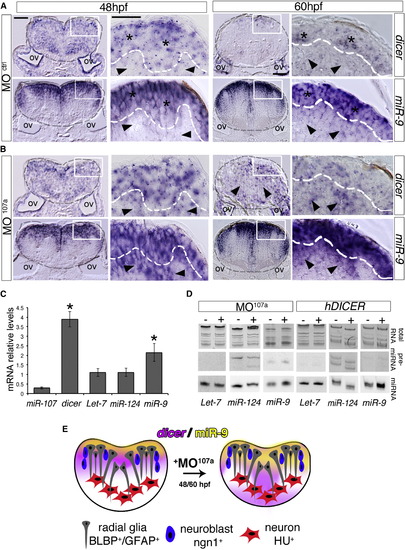
miR-107 Is Required to Control Dicer and miR-9 Expression across the Hindbrain Ventricular Zone (A and B) Expression of dicer and miR-9 in hindbrain cross-sections of MOctrl- and MO107a-injected embryos at 48 and 60 hpf. Area inside of the gray dashed line indicates the hindbrain area; black stars in (A) show dicer and miR-9-positive areas, while black arrowheads show dicer and miR-9 low expression. Black arrowheads in (B) show dicer and miR-9 ectopic expression. Dorsal is up. (C) qRT-PCR of dicer mRNA and the indicated miRNAs in MO107a embryos at 60 hpf. Levels are relative to MOctrl embryos. Error bars represent the ± SD between three independent experiments (n ~20 embryos each). p < 0.05. (D) Northern blot analysis of total RNA extracted from 60 hpf embryos injected with MO107a, MOctrl, or human DICER mRNA. The images are representative of two independent experiments. (E) Schematic representation of the effect of MO107a on dicer (purple) and miR-9 (yellow) pattern expression at 48 and 60 hpf embryos. Scale bars represent 50 µm. |
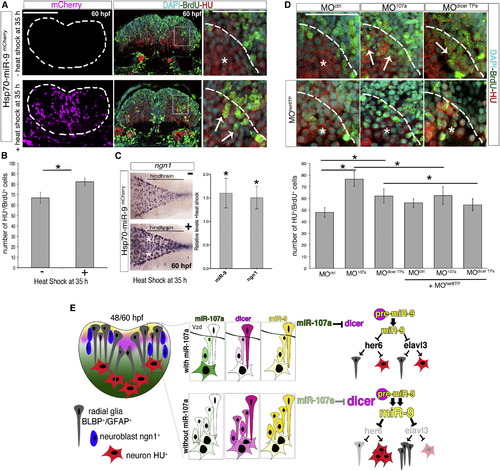
The Increase of miR-9 Accumulation Promotes Hindbrain Neurogenesis in the Absence of miR-107 and Dicer Posttranscriptional Regulation (A) Comparison of the number of BrdU/HU double positive cells in embryos injected with the Hsp70-miR-9mCherry plasmid with or without heat-shock. mCherry-positive cells (purple) indicate the cells overexpressing miR-9. HU, BrdU, and DAPI triple staining was performed in the same hindbrain cross-section at 60 hpf. White arrows in the high-magnification (60×) pictures indicate increased number of BrdU/HU double-positive cells migrating in the mantle area (dashed line). (B) Number of BrdU and HU double-positive cells. Data are presented as mean ± SEM (n = 5 embryos each group). p < 0.05. (C) Expression of ngn1 in 60 hpf embryos treated as described above. Dorsal is up and anterior is left. White stars indicate ngn1 expression observed in 30% ± 5% of the heat-shocked embryos (n = 15) compared with the ngn1 expression in non-heat-shocked embryos (n = 20). The chart shows the quantification by qRT-PCR of miR-9 and ngn1 expression level in the brain of 60 hpf embryos treated as above and following heat shock. Levels are relative to the control without heat shock. Data are presented as mean ± SEM (n = 3). p < 0.05. (D) High magnifications (60×) of hindbrain cross-sections showing BrdU/HU double-positive cells in embryos at 60 hpf injected with MOctrl, MO107a, or MOdicer TPs with or without MOher6TP. Whole cross-sections are shown in Figure S5D. Arrows indicate the BrdU/HU double-positive cells. Stars indicate DAPI nuclei of BrdU-negative and HU-positive cells in the same area. The chart shows the number of HU and BrdU double-positive cells in the indicated treatment. Data represent the mean ± SEM (n = 6 to 9 embryos for each experimental condition). p < 0.05. (E) Schematic representation of the miR-107 (green)-dicer (pink) signaling pathway controlling miR-9 (yellow) biogenesis during hindbrain neurogenesis. Scale bars represent 50 µm. PHENOTYPE:
|
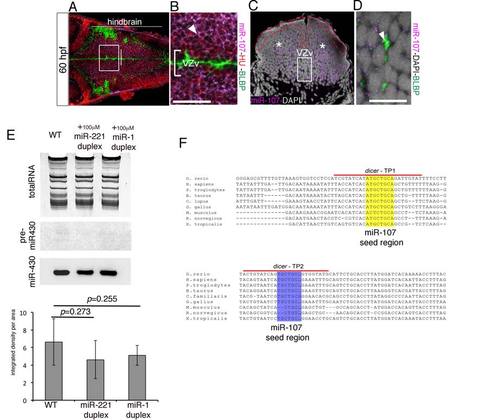
miR-107 pattern expression and gain-of-function experiment, related to Figure 1 and Figure 2. (A-B) Confocal coronal sections of a whole-mount 60 hpf embryo immunostained for HU and BLBP proteins and developed for miR-107 in situ hybridization. (B) High magnification of the white square insert in (A). The white arrow indicates miR-107 and HU double positive cells. (C) 15 µm hindbrain cross-section of a 60 hpf embryo at the level of the otic vesicle (OV) indicated by the white line in (A). Red dashed line highlights the lack of miR-107 in the ventricular hindbrain region. White stars indicate miR-107 positive expression in the mantle area of the hindbrain. (D) High magnification of the region boxed in (C) stained with anti-BLBP antibody. Arrowhead shows BLBP expression in miR-107 negative cells. (E) Northern Blot showing miR-430 biogenesis in 24 hpf embryos injected as indicated. WT (un-injected embryos) were used as controls. The image is representative of three experiments. Quantification of miR-430 mature sequence levels in each experimental condition measured as integrated intensity per area. (F) ClustalW partial alignment of the conserved dicer 3′UTR sequences containing 2 binding sites for miR-107. dicer-TP1 and dicer-TP2 highlight the regions where target protector morpholinos were designed. dicer-TP1 protects the 8 bp miR-107 seed region binding site (yellow); dicer-TP2 protects the 7 bp miR-107 seed region binding site (purple). Scale bars= 50µm. |
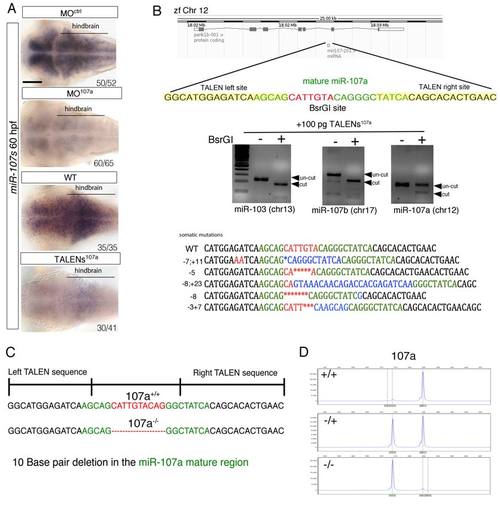
Generation of miR-107a mutants using TALEN strategy, related to Figure 4. (A) Dorsal view of whole-mount miR-107 in situ hybridization of 60 hpf embryos treated as indicated. Dorsal is up, anterior is to the left. The numbers grafted in the pictures indicate the number of embryos with the staining represented in the picture versus the total number of embryos analyzed. (B) Graphic view of the TALENs strategy design. Left and right TALEN binding sites in the pri-miRNA-107a locus within the zebrafish chromosome 12 are indicated. TALEN binding and cutting activity was assessed by the loss of a BsrGI site (red sequence) within the miR-107a mature sequence. Deletions and/or insertions where observed only in the miR-107a locus and not in the miR-107b and miR-103 genome regions, the other members of the zebrafishmiR-107/103 miRNAs family. (C-D) F2 founders were selected after out-crossing the F1 mosaic adult animals with a WT strain. F2 females and males were selected by fragment analysis, a 10 bp mutation was identified by sequencing the genome of the miR-107a F2 positive founder. Scale bars= 50µm. |
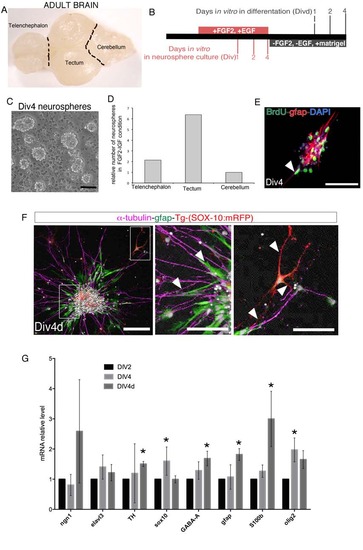
Isolation and differentiation of zebrafish neurospheres, related to Figure 5. (A) Dorsal view of a whole-mount zebrafish adult brain (~10 months). Black dotted lines indicate the anatomical dissection performed to separate different regions of the brain. (B) Schematic representation of neurophere preparation starting from the brain regions indicated in (A). (C) Bright-field image of neurospheres after 4 days in vitro (Div4). (D) Chart representing the number of neurospheres at Div4 generated from neural cells isolated from telencephalon and tectum relative to the cerebellum area. Data are representative of two independent experiments. (E) Immunostaining of GFAP protein and BrdU incorporated in neurospheres at Div4. White arrow indicates GFAP positive cells. (F) Immunolocalization of the indicated proteins in one neurosphere at 4 days in vitro after differentiation (Div4d). Right panels are high magnifications of the regions highlighted in the left image. Arrowheads show the cells labeled with the indicated antibodies and for the expression of the mCherry under the SOX10 promoter sequence. (G) qRT-PCR quantification of the indicated genes expressed in neurosphere cultures at Div4 and at Div4d. Levels are relative to Div2. Data represent the mean ± SEM (n=3).* p<0.05. Scale bars= 50µm. |
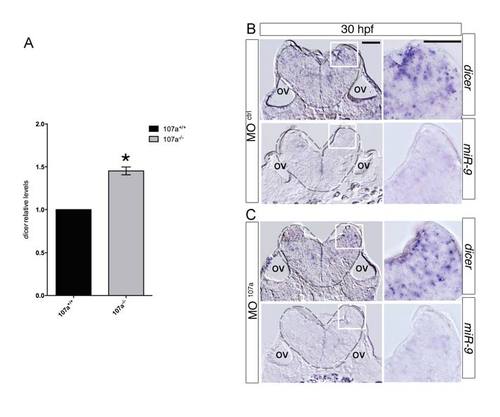
dicer and mir9 expression in absence of miR-107a, related to Figure 6. (A) qRT-PCR of dicer levels in 60 hpf 107a TALEN embryos. Levels in miR-107a null embryos (107a-/-) are relative to the WT control (107a+/+). Data are mean ± SEM (n=2).*p<0.05. (B) Expression of dicer and miR-9 in hindbrain cross-sections of MOctrl and MO107a injected embryos at 30 hpf. EXPRESSION / LABELING:
|
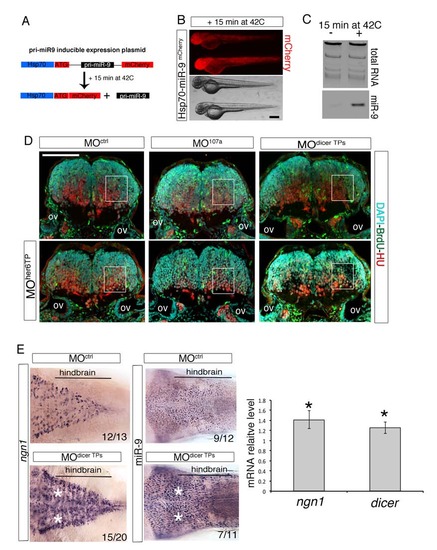
miR-9 overexpression strategy and stabilization of dicer, miR-9 and ngn1 hindbrain expression upon dicer-3′UTR protection. Related to Figure 7. (A) Cartoon describing the strategy adopted for the inducible miR-9 gain-of-function experiment (see Experimental Procedures for details). (B) Fluorescent and bright-field images of whole-mount zebrafish embryos at 48 hpf injected with the Hsp70-miR-9mCherry plasmid at the one-cell stage and heatshocked at 35 hpf for 15 min at 42°C. Anterior is to the left. |
Reprinted from Developmental Cell, 32(5), Ristori, E., Lopez-Ramirez, M.A., Narayanan, A., Hill-Teran, G., Moro, A., Calvo, C.F., Thomas, J.L., Nicoli, S., A Dicer-miR-107 Interaction Regulates Biogenesis of Specific miRNAs Crucial for Neurogenesis, 546-60, Copyright (2015) with permission from Elsevier. Full text @ Dev. Cell