
- Title
-
Interkinetic Nuclear Migration Is Centrosome Independent and Ensures Apical Cell Division to Maintain Tissue Integrity
- Authors
- Strzyz, P.J., Lee, H.O., Sidhaye, J., Weber, I.P., Leung, L.C., Norden, C.
- Source
- Full text @ Dev. Cell
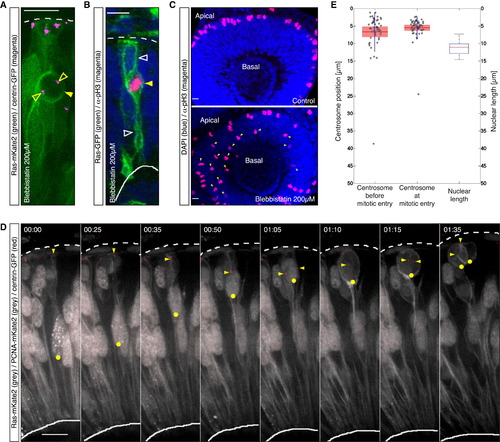
Mitotic Entry Is Not Restricted to the Apical Surface in Zebrafish Retinal NE; Centrosomes Are Maintained Apically throughout the Cell Cycle (A) Confocal scan of a cell expressing Ras-mKate2 (green) and centrin-GFP (magenta) in an embryo treated with 200 µM blebbistatin 1.5 hr before imaging. The cell shows nonapical mitotic rounding (filled arrow) and is associated with centrosomes (open arrows). (B) Confocal scan of a cell expressing Ras-GFP (green) stained for pH3 (magenta) in an embryo treated with 200 µM blebbistatin 1.5 hr before fixing. The cell features nonapical pH3 signal (filled arrow) while maintaining apical and basal attachments (open arrows). (C) Confocal scans of the retinae of an embryo treated with 200 µM blebbistatin 1.5 hr before fixing (lower) and a control embryo (upper) stained for pH3 (magenta). Blebbistatin treated cells enter mitosis nonapically (lower, arrows). (D) Time-lapse of the dynamics of the nucleus-centrosome pair with respect to cell cycle progression. PCNA-RFP labels nuclei and marks the cell cycle stage (gray). Ras-mKate2 (gray) labels cell membranes. Centrin-GFP (red) labels centrosomes. One nucleus is labeled with a yellow dot. The arrow highlights the position of the centrosome. Time is in hr:min. The frames are from Movie S1. (E) Centrosome position prior to centrosome splitting (left) and the mean value of the position of centrosomes at mitosis (middle) with respect to nuclear length (right), n = 51 cells, 4 embryos. Scale bars represent 10 µm. The dotted line represents the apical surface, and the solid line represents the basal side. |
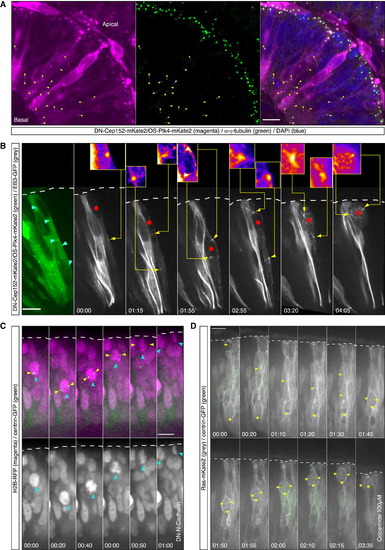
Apical IKNM Persists in Cells in which Centrosomes and Nucleus Meet Nonapically Even following Nonapical Mitotic Entry (A) Confocal scan of a HS-DN-Cep152-mKate2/HS-OS-Plk4-mKate2 expressing embryo. Positive cells feature cytosolic mKate2 signal as well as foci of signal along the apicobasal axis (magenta). Foci are positive for γ-tubulin staining (green). Nonapical foci positive for mKate2 and immunopositive for γ-tubulin are marked with yellow arrows. HS was performed 8 hr prior to fixing. See also (B) Time-lapse of a cell expressing HS-DN-Cep152-mKate2, HS-OS-Plk4-mKate2 (green), and the dynamic MTs marker HS-EB3-GFP (gray). (Left) Cytosolic mKate2 signal and nonapical foci (cyan outlined arrows) in the cell of interest are shown. The remaining panels show distribution of dynamic MTs. Clear foci of nonapical MT nucleation can be observed (yellow arrows). In the insets, magnified regions of nonapical MT nucleation sites are shown in fire lookup table (in panels 4 and 7, 1.5× magnification, remaining panels 3× magnification). The red dot marks the position of the nucleus. HS was performed 12.5 hr prior to time-lapse. Time is in hr:min. The frames are from Movie S2. (C) Time-lapse of a cell expressing DN-N-Cadherin. HS-H2B-RFP labels nuclei/chromatin (magenta in the upper and gray in the lower) and centrin-GFP-RNA labels centrosomes (green, upper panel only). The centrosome (yellow arrow) associates with the nucleus (cyan, arrow) in a nonapical position (upper). The cell enters mitosis nonapically as visualized by chromosome condensation (lower, 00:40, cyan arrow). Apical IKNM and apical division occur. HS was preformed 17.5 hr prior to time-lapse. Time is in hr:min. The frames are from Movie S2. See also Figure S2. (D) Time-lapse of a cell in an embryo treated with 100 µM colcemide. The cell expresses Ras-mKate2 (gray) and centrin-GFP (green). In the cell of interest the split centrosome (yellow arrows) travels basally and associates with the nucleus (yellow dot) nonapically. After nonapical cell rounding (01:50), the cell performs apical IKNM. Time-lapse was started 5 hr after drug addition. Time is in hr:min. The frames are from Movie S3. Scale bars represent 10 µm. The dotted line represents the apical surface. |
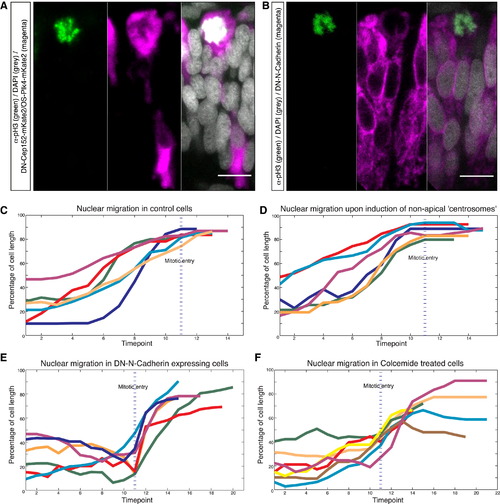
Apical IKNM Persists Despite Nonapical Mitotic Entry (A and B) pH3 stainings (green) of embryos expressing HS-DN-Cep152-mKate2/HS-OS-Plk4-mKate2 (A) or DN-N-Cadherin (B) (both magenta). (C–F) Tracks of nuclear position around mitosis in (C) control cells, (D) cells featuring nonapical centrosomes, (E) cells expressing DN-N-Cadherin, (F) cells treated with 100µM colcemide. Time shown in time points (tp). 1 tp = 5 min. Nuclear position was tracked 10 tp (= 50 min) prior to and 10 tp after mitotic entry or until division. Nuclear position has been measured from the base of the nucleus to the basal lamina and was normalized with respect to cell length. Each track represents a single nucleus; tp of mitotic entry is marked with blue line (always at tp = 11). Scale bars represent 10 µm. |
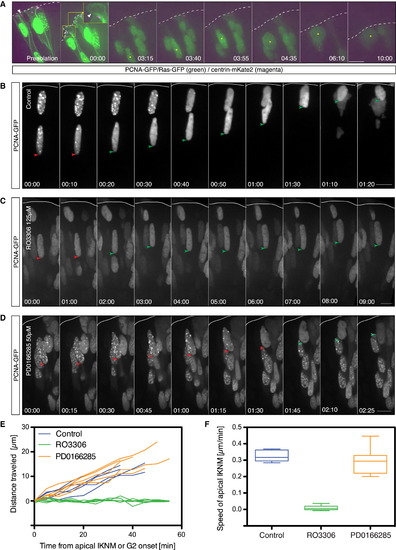
Apical IKNM Does Not Depend on Centrosome Integrity; CDK1 Activity Is Necessary and Sufficient for Apical IKNM (A) Time-lapse imaging of a cell following laser ablation of the apical centrosome. (Left-most panel) Cell prior to ablation. The nucleus is labeled with PCNA-GFP (green). The membrane is visualized with Ras-GFP (green) and the centrosome with centrin-mKate2 (magenta, white arrow). After ablation (00:00), no centrin signal can be detected in the apical process (white arrow). The yellow box in panel 00:00 shows a 2× magnified region of the apical endfoot. The following panels show nuclear behavior following ablation marked by a yellow arrow. Time is in hr:min. The frames are from Movie S4. See also Figure S2. (B–D) Time-lapse of cells expressing PCNA-GFP (gray) upon treatment with (B) DMSO only, (C) CDK1 inhibitor (RO3306), (D) Wee1 inhibitor (PD166285). Red arrows mark cells in S-phase (PCNA dots), and green arrows mark cells in G2 (disappearance of PCNA dots). Time is in hr:min. The frames are from Movie S5. (E) Tracks of nuclear movements in the different drug conditions starting at the onset of apical IKNM (PD0166285), the entry into G2 phase (RO3306), or both (control). (F) Average speed of apical nuclear migration in different conditions. Speed was calculated as total distance traveled by nuclei over time (µm/min). Error bars represent SEM. Scale bars represent 10 µm. Apical surface is represented by a dotted line in (A) and a solid line in (B)–(D). |
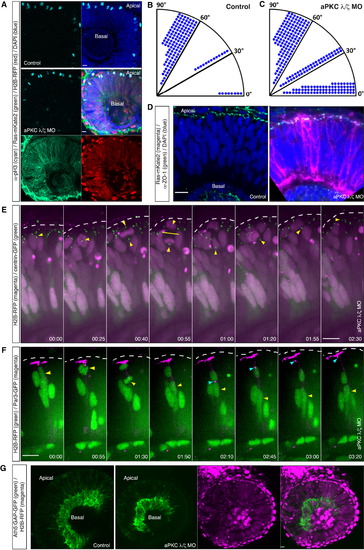
Nonperpendicular Apical Divisions Do Not Majorly Perturb Retinal Tissue Architecture and Early Neuronal Layering (A) Images of aPKC γ/ζ MO-injected embryo (middle and lower) and a control embryo (upper). Ras-mKate2 RNA (green) and H2B-RFP RNA (red) were injected to visualize morphant cells together with MOs. Embryos were fixed at 34 hpf and stained with pH3 antibody to visualize mitotic cells (cyan). In control and morphant embryos, mitoses occur apically. (B and C) Division angles of the control (B) and aPKC γ/ζ morphant cells (C). Dots indicate individual cells. In morphant cells, the clear bias for perpendicular divisions (angles 60°–90°) is lost. (B) n = 145 cells, 7 embryos; (C) n = 241 cells, 8 embryos. (D) Confocal images of a control (left) and an aPKC γ/ζ morphant embryo (right). Ras-GFP RNA (magenta) was injected together with MOs to visualize morphant cells. Embryos were fixed at 34 hpf and stained with ZO-1 antibody (green). In both cases, ZO-1 signal appears as a continuous apical belt. (E) Time-lapse of an aPKC γ/ζ morphant embryo coinjected with H2B-RFP RNA (magenta) and centrin-GFP RNA (green). Morphant cell divides horizontally (00:55, yellow bar). The more basal centrosome (yellow arrow) descends to the apical surface. Time is in hr:min. The frames are from Movie S6. See also Figure S2. (F) Time-lapse of an aPKC γ/ζ morphant embryo coinjected with H2B-RFP RNA (green) and Par3-GFP RNA (magenta). Morphant cell divides horizontally (01:30). The more basal daughter (yellow arrow) re-establishes its apical Par3 domain (cyan arrow). Time is in hr:min. The frames are from Movie S6. (G) Early neuronal layer, RGC (marked by Tg(Ath5:GAP-GFP), green) layer in a control embryo (left-most panel) and an aPKC γ/ζ morphant embryo (remaining panels). Morphant cells were marked by coinjection of H2B-RFP RNA (magenta). Both in the morphant and the control embryo an intact RGC layer (green) is formed next to the lens. Morphant cells (magenta) contribute to this layer (rightmost panel). Scale bars represent 10 µm. The dotted line represents the apical surface. |
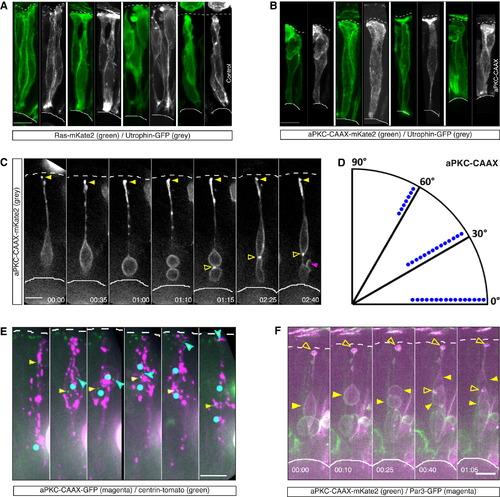
Interference with Actin Distribution via Membranous Expression of aPKC-CAAX Leads to Nonapical Divisions (A) Confocal scans of actin organization in control cells. Cells were coinjected with HS-Ras-mKate2 (green, membrane) and HS-Utrophin-GFP (F-actin, gray). Actin is organized in distinct filaments. HS was performed 7 hr prior to fixation. (B) Confocal scans of actin organization in HS-aPKC-CAAX-mKate2 (green) expressing cells coinjected with HS-Utrophin-GFP (F-actin, gray). Actin is diffusely organized without a clear filamentous structure along the cell membrane, despite a clear apical signal. HS is 7 hr prior to fixation. (C) Time-lapse of a cell expressing aPKC-CAAX-mKate2 (gray). The cell divides nonapically with a horizontal cleavage plane (01:10), while maintaining its apical attachment (yellow filled arrow). The more apical daughter cell maintains its apical process attachment, while the more basal daughter forms an ectopic connection to the sister cell (open arrow). Later, the basal daughter shows protrusive activity (magenta arrow). HS was performed 9.5 hr prior to time-lapse. Time is in hr:min. The frames are from Movie S7. See also Figure S3. (D) Division angles of the aPKC-CAAX expressing cells dividing nonapically. Dots indicate individual cells. Cells lose clear bias for perpendicular divisions (angles 60° to 90°) observed in controls (Figure 5B), n = 37 cells, 8 embryos. (E) Time-lapse of a cell expressing HS-aPKC-CAAX-GFP (magenta) and centrin-tomato (green). The cell divides nonapically with a nonperpendicular cleavage plane (02:35). The centrosome of the more apical daughter (cyan-outlined arrow) descends to the apical surface. The centrosome of the more basal daughter (yellow arrow) remains basally. Blue dots represent soma/nuclear position. HS was performed 11.5 hr prior to time-lapse. Time is in hr:min. The frames are from Movie S7. See also Figure S3. (F) Time-lapse of a cell expressing HS-aPKC-CAAX-mKate2 (green) and HS-Par3-GFP (magenta). The cell divides nonapically with a horizontal cleavage plane (00:25), while maintaining apical process and apical Par3 signal (open arrow). Later, the basal daughter forms an ectopic, basal Par3 domain (open arrow). HS was performed 8 hr prior to the time-lapse. Time is in hr:min. The frames are from Movie S7. Scale bars represent 10 µm. The dotted line represents the apical surface, and the solid line represents the basal side. |
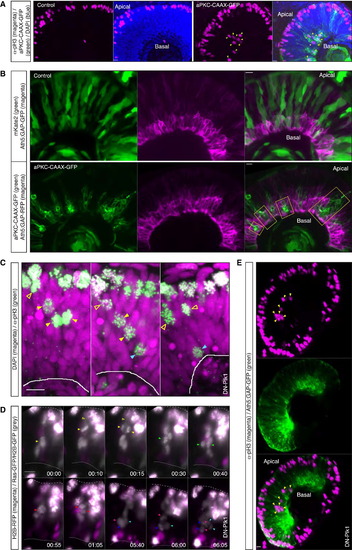
Nonapical, Nonperpendicular Divisions Perturb Tissue Integrity and Early Neuronal Layering (A) Confocal scans of a control embryo (left) and a HS-aPKC-CAAX-GFP injected embryo 24 hphs (right). Embryos were fixed at 50 hpf and stained with pH3 antibody. aPKC-CAAX expressing, mitotic cells can be observed at basal locations (arrows). (B) Confocal scans of a control embryo injected with HS inducible cytosolic mKate2 (upper) and a HS-aPKC-CAAX-GFP injected embryo (lower) at 56 hpf/30 hphs. To visualize RGCs, the Tg(Ath5:GAP-RFP) line was used for aPKC-CAAX and Tg(Ath5:GAP-GFP) line for cytosolic mKate2 injection (RGCs, magenta). Control injected cells (green, upper) contribute to the intact RGC layer. In aPKC-CAAX expressing embryos the RGC layer features holes, filled by aPKC-CAAX (green) expressing cells (yellow boxes). See also Figure S4. (C) Confocal scans of DN-Plk1 injected embryos stained with pH3 antibody (green) to visualize mitotic cells. DAPI is shown in magenta. DN-Plk1 expressing cells, arrested in mitosis, form an apical barrier. As a result, pH3-positive nuclei can be observed away from the apical surface (arrows: yellow open, subapical pH3; yellow filled, pH3 in the middle of the NE; cyan, basal pH3). HS was performed 11 hr prior to fixation. (D) Time-lapse of cells in the embryo expressing DN-Plk1. DN-Plk1-positive cells coexpress H2B-RFP (magenta). To follow cell dynamics of nonmanipulated cells, H2B-GFP and Ras-GFP RNAs were injected mosaically (gray). Multiple non-DN-Plk1 cells can be observed dividing nonapically (arrows). Initially cells divide close to the apical barrier and maintain their apical process (yellow open arrows). Later in development, divisions occur at more basal locations (green, red, and blue arrows). HS was performed 11 hr prior to time-lapse. Time is in hr:min. The frames are from Movie S8. See also Figure S4. (E) Confocal scans of Tg(Ath5:GAP-GFP) (green) embryos 53 hpf injected with DN-Plk1 and stained with pH3 antibody (magenta). pH3-positive nuclei can be observed at very basal locations (arrows). The RGC layer is disturbed in the central region of the retina, where the pH3-positive cells reside. HS was performed 29 hr prior to fixation. See also Figure S4. Scale bars represent 10 µm. The dotted line represents the apical surface, and the solid line represents the basal side. |
Reprinted from Developmental Cell, 32(2), Strzyz, P.J., Lee, H.O., Sidhaye, J., Weber, I.P., Leung, L.C., Norden, C., Interkinetic Nuclear Migration Is Centrosome Independent and Ensures Apical Cell Division to Maintain Tissue Integrity, 203-19, Copyright (2015) with permission from Elsevier. Full text @ Dev. Cell