
- Title
-
Fructose leads to hepatic steatosis in zebrafish that is reversed by mTOR inhibition
- Authors
- Sapp, V., Gaffney, L., EauClaire, S.F., Matthews, R.P.
- Source
- Full text @ Hepatology
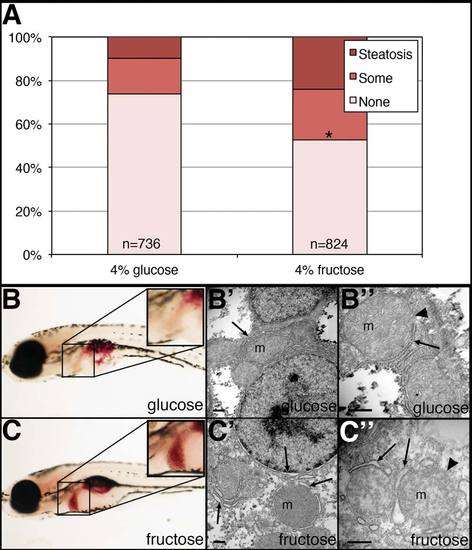
NASH-like phenotype in zebrafish larvae treated in fructose. Larvae were placed in 4% fructose or isocaloric 4% glucose at 5 dpf, then examined at 7 dpf. Larvae were fixed and then stained with ORO and the amount of steatosis was quantified. Larvae for electron microscopy were fixed in buffered glutaraldehyde, processed, and examined. (A) Quantification of hepatic steatosis in 4% glucose and 4% fructose-treated larvae. Larvae were examined in a blinded fashion and were categorized as having “steatosis,” “some” steatosis, or “none.” Shown are the percentages of each category in the glucose- and fructose-treated larvae, with the total number of larvae examined noted. Larvae with steatosis or some steatosis are increased in the fructose-treated larvae in a highly significant manner (*P ~ 0, chi-square analysis). (B) ORO staining of glucose-treated larva, showing “some” liver steatosis (inset). (B′, B") Electron micrographs of liver from glucose-treated larva, showing normal mitochondria (m), normal endoplasmic reticulum (arrow), and normal mitochondrial membrane (arrowhead). (C) ORO staining of fructose-treated larva, showing steatosis in the liver (inset). (C′, C") Electron micrographs of liver from fructose-treated larva, showing mitochondria (m), dilated endoplasmic reticulum (arrow), and less distinct mitochondrial membrane (arrowhead). Scale bars = 500 nm. PHENOTYPE:
|

ZFIN is incorporating published figure images and captions as part of an ongoing project. Figures from some publications have not yet been curated, or are not available for display because of copyright restrictions. |
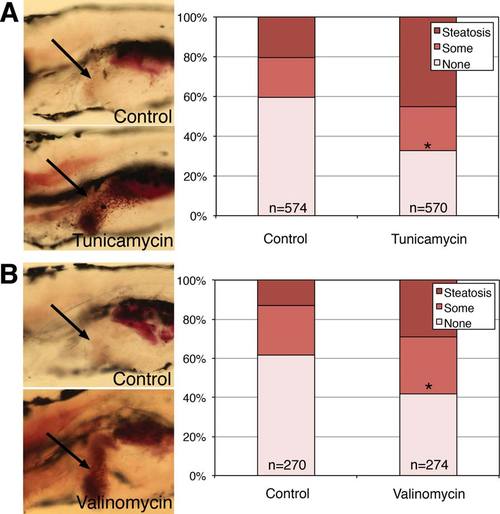
NASH-like phenotype in zebrafish larvae treated with the ER stress inducer tunicamycin or the oxidative stress inducer valinomycin. Larvae were placed in vehicle control or in tunicamycin or valinomycin at 5 dpf, then examined at 7 dpf. Larvae were fixed and then stained with ORO and the amount of steatosis was quantified. (A,B) Quantification of hepatic steatosis in control versus (A) tunicamycin-treated or (B) valinomycin-treated larvae. An example of each is shown, with the liver noted by the black arrow. Note the red punctate staining in the liver of the tunicamycin-treated and valinomycin-treated larvae. Quantification of steatosis is shown to the right, categorized as “steatosis,” “some” steatosis, or “none.” Shown are the percentages of each category in (A) control versus tunicamycin treated and (B) control versus valinomycin-treated larvae, and the total number of larvae in each condition is noted. Larvae with steatosis or some steatosis are increased in both the tunicamycin- and valinomycin-treated larvae in a highly significant manner (*P H 0 by chi-square analysis). PHENOTYPE:
|
|
ZFIN is incorporating published figure images and captions as part of an ongoing project. Figures from some publications have not yet been curated, or are not available for display because of copyright restrictions. |
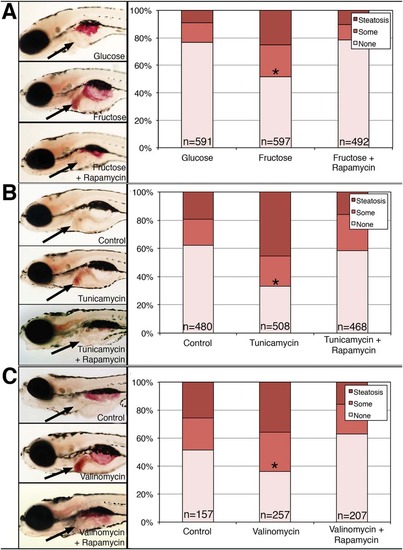
Zebrafish models of NASH are mediated through mTOR. Larvae were placed in (A) 4% glucose, 4% fructose, or 4% fructose and rapamycin, or (B) control, tunicamycin, or tunicamycin and rapamycin, or (C) control, valinomycin, or valinomycin and rapamycin at 5 dpf and then examined at 7 dpf. Larvae were fixed and then stained with ORO and the amount of steatosis was quantified. (A-C) Quantification of hepatic steatosis in (A) glucose, fructose, and fructose + rapamycin-treated larvae, or control versus (B) tunicamycin- and tunicamycin + rapamycin-treated or (C) valinomycin- and valinomycin + rapamycin-treated larvae. An example of each is shown, with the liver noted by the black arrow. Note the red punctate staining in the liver of all three treatments that is not present in the larvae also treated with rapamycin. Quantification of steatosis is shown to the right, categorized as “steatosis,” “some” steatosis, or “none.” Shown are the percentages of each category in (A) glucose, fructose, and fructose + rapamycin-treated larvae, or control versus (B) tunicamycin- and tunicamycin + rapamycin-treated or (C) valinomycin- and valinomycin + rapamycin-treated larvae, and the total number of larvae in each condition is noted. The increase in larvae with steatosis or some steatosis in all three treated conditions, relative to their respective controls and relative to the rapamycin-treated conditions, is highly significant (*P ~ 0 by chi-square analysis). PHENOTYPE:
|

Increased liver size in larvae treated with fructose. Larvae treated with 4% glucose or 4% fructose were fixed in 4% paraformaldehyde at 7 dpf. After bleaching, the larvae were subjected to in situ hybridization in accordance with standard protocols, using cp (ceruloplasmin) as riboprobe, as in previous studies (1). Three separate sets of larvae underwent in situ hybridization. (A) Average liver size, as determined by ImageJ analysis of the area of liver staining. The graph depicts the mean, normalized to glucose, with S.E.M. As mentioned, three separate trials are averaged, comprising 20, 17 and 12 larvae for glucose, and 21, 15, and 27 larvae for fructose. (B) Six representative larvae from glucose and fructose categories, with cp liver staining noted (arrow). *p≤0.05 by Student’s t test. PHENOTYPE:
|
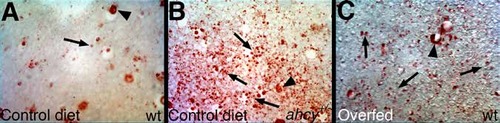
Hepatic steatosis in ahcy+/- adult zebrafish and in wild-type adults fed excess food. Shown are liver sections from (A) wild-type (wt) adult zebrafish fed a normal (control) diet, (B) ahcy+/- (dtp+/-) adults fed a control diet, and (C) wt adults fed excess brine shrimp ad lib. After sectioning, slides were stained with oil red O (ORO). Note the nonspecific accumulation of ORO in sinusoids in all conditions (arrowheads), and the lipid droplets (arrows) that are more prevalent in (B) and (C). Original magnification 200x. PHENOTYPE:
|