
|
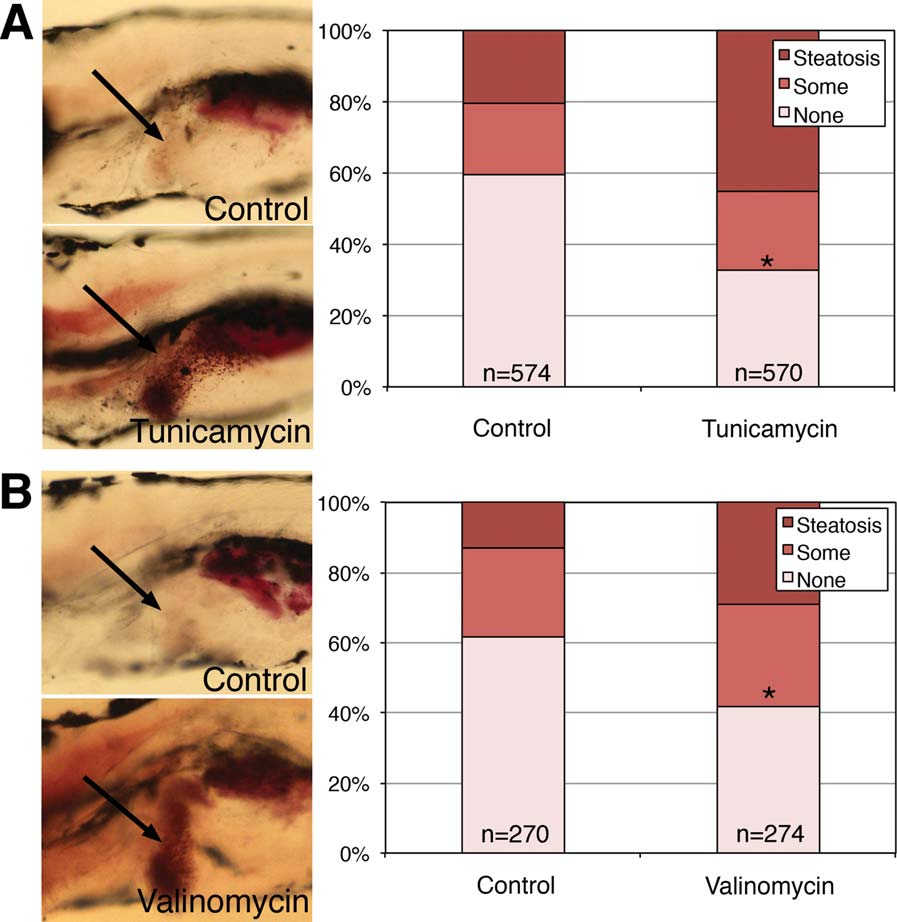
Fig. 3
NASH-like phenotype in zebrafish larvae treated with the ER stress inducer tunicamycin or the oxidative stress inducer valinomycin. Larvae were placed in vehicle control or in tunicamycin or valinomycin at 5 dpf, then examined at 7 dpf. Larvae were fixed and then stained with ORO and the amount of steatosis was quantified. (A,B) Quantification of hepatic steatosis in control versus (A) tunicamycin-treated or (B) valinomycin-treated larvae. An example of each is shown, with the liver noted by the black arrow. Note the red punctate staining in the liver of the tunicamycin-treated and valinomycin-treated larvae. Quantification of steatosis is shown to the right, categorized as “steatosis,” “some” steatosis, or “none.” Shown are the percentages of each category in (A) control versus tunicamycin treated and (B) control versus valinomycin-treated larvae, and the total number of larvae in each condition is noted. Larvae with steatosis or some steatosis are increased in both the tunicamycin- and valinomycin-treated larvae in a highly significant manner (*P H 0 by chi-square analysis).