
- Title
-
SoxF factors and Notch regulate nr2f2 gene expression during venous differentiation in zebrafish
- Authors
- Swift, M.R., Pham, V.N., Castranova, D., Bell, K., Poole, R.J., Weinstein, B.M.
- Source
- Full text @ Dev. Biol.
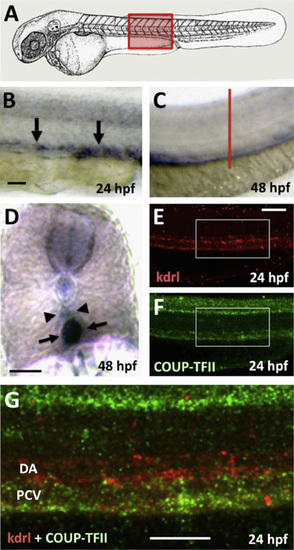
Expression of nr2f2 in developing veins in the zebrafish. (A) Schematic diagram of a 1 dpf zebrafish (modified from Kimmel et al., 1995)) with a red box showing the approximate position of images in B–G. (B–D) Whole mount in situ hybridization of the trunks of 24 hpf (B) and 48 hpf (C and D) zebrafish embryos probed for nr2f2. (E–G) Two-color fluorescent in situ hybridization of the trunk of a 24 hpf animal probed for kdrl (in red; panels E and G) and nr2f2 (green; panels F and G). Images are all lateral views of the trunks of whole mount stained animals (anterior to the left) except for panel D, which shows a transverse thick section through the trunk (the red line in panel C indicates the plane of section shown in panel D). Arrows in panels B, D, and G point to posterior cardinal vein expression of nr2f2, while arrowheads in panels D and G note the position of the dorsal aorta. Rostral is to the left and dorsal is up in all image panels. Scale bars, (B, C, E, F, and G) 100µm, (D) 50µm. |
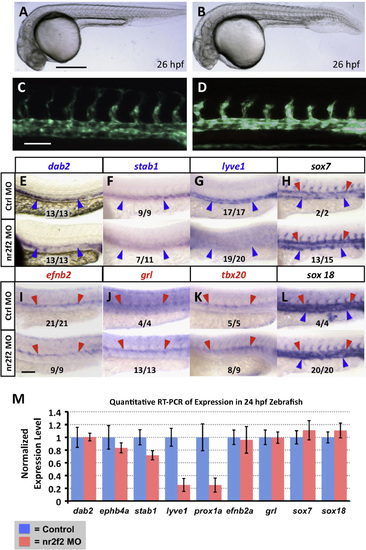
nr2f2 function is required for proper venous gene expression in the zebrafish vasculature. (A–D) Transmitted light (A and B) and green fluorescent light (C and D) images of control (A and C) and nr2f2 morpholino injected (B and D) Tg(fli1a-EGFP)y1 transgenic animals. (E–L) Whole mount in situ hybridization of 24 hpf control (top) and nr2f2 morpholino injected (bottom) zebrafish embryo trunks probed for ephb4a (E), stab1 (F), lyve1 (G), sox7 (H), efnb2a (I), grl (J), tbx20 (K), and sox18 (L). Blue arrowheads note posterior cardinal vein gene expression, while red arrows note dorsal aorta gene expression. The inset numbers in panels F–L show the number of in situ-stained nr2f2 MO-injected embryos exhibiting the phenotype shown in the image panel over the total number of embryos examined. (M) Quantitative RT-PCR measurement of gene expression in excised trunks (see Materials and Methods) of 24 hpf control and nr2f2 morpholino injected animals. Values are all normalized to control gene expression levels, which are set equal to 1. Rostral is to the left and dorsal is up in all image panels. Scale bars, (A and B) 500µm, (C–L) 100µm. |
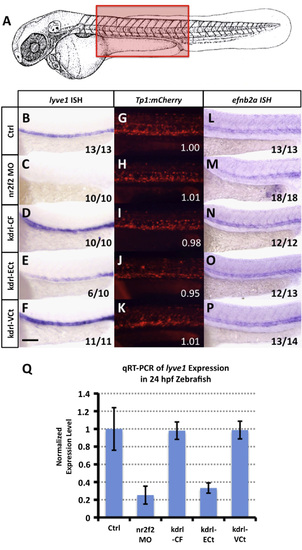
nr2f2 does not regulate Notch in the zebrafish vasculature. (A) Schematic diagram of a 1 dpf zebrafish (modified from Kimmel et al., 1995) with a red box showing the approximate position of images in B–V. (B–F) Whole mount in situ hybridization of 24 hpf zebrafish probed for lyve1. (G–K) Red fluorescent confocal micrographs of 24 hpf Tg(Tp1bglob:hmgb1-mCherry)h11 (“Tp1:mCherry”) transgenic zebrafish. Inset numbers show quantitative measurements of trunk vascular mCherry fluorescence in a single representative injected fish normalized to trunk neural mCherry fluorescence and to values in untreated controls (G). See Materials and Methods for additional information on measurements. (L–P) Whole mount in situ hybridization of 24 hpf zebrafish probed for efnb2a. Animals in image panels B–P were either untreated (B, G and L), injected with nr2f2 MO (C, H and M), injected with kdrl-CF (Full length nr2f2 under the control of the kdrl promoter; D, I and N), injected with kdrl-ECt (chimeric protein with nr2f2 lacking the transactivation domain fused to engrailed repressor domain; E, J and O), or injected with kdrl-VCt (chimeric protein with nr2f2 lacking the transactivation domain fused to VP16; F,K,P). The inset numbers in panels C–F and M–P show the number of in situ-stained embryos exhibiting the phenotype shown in the image panel over the total number of embryos examined. (Q) Quantitative RT-PCR measurement of gene expression in excised trunks of 24 hpf animals (see Materials and Methods). Values are all normalized to control gene expression levels, which are set equal to 1. Rostral is to the left and dorsal is up in all image panels. Scale bar, 100µm. |
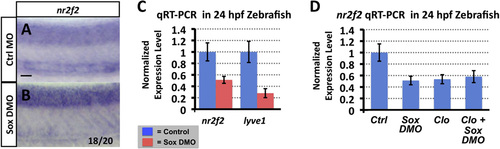
Sox gene function is required for nr2f2 expression in the zebrafish vasculature. (A and B) Whole mount in situ hybridization of 24 hpf control (A) and sox7/sox18 double morpholino (DMO) injected (B) zebrafish embryo trunks probed for nr2f2. The inset numbers in panels B show the number of in situ-stained embryos exhibiting strongly reduced or absent vascular expression over the total number of embryos examined. (C) Quantitative RT-PCR measurement of nr2f2 and lyve1 gene expression in excised trunks (see Materials and Methods of 24 hpf control and sox7/sox18 DMO animals. (D) Quantitative RT-PCR measurement of nr2f2 gene expression in excised trunks (see Materials and Methods) of 24 hpf control MO injected, sox7/sox18 DMO injected, cloche mutant, and sox7/sox18 DMO injected cloche mutant animals. All quantitative RT-PCR values are shown normalized to control gene expression levels, which are set equal to 1. Rostral is to the left and dorsal is up in all image panels. Scale bars, 50µm. |
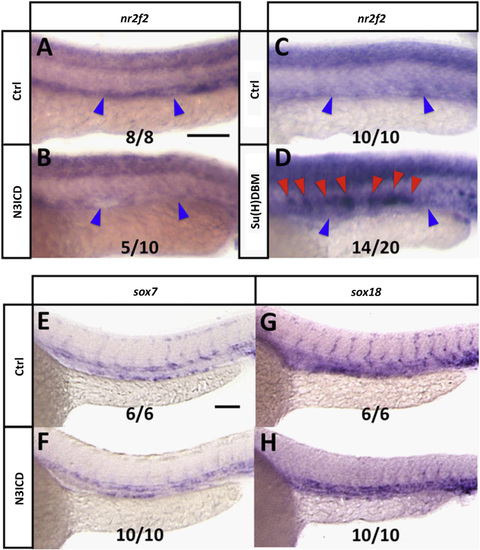
Notch negatively regulates nr2f2 in the zebrafish vasculature, but not via Sox. (A and B) Whole mount in situ hybridization of 24 hpf control (A) and Tg[fli1a:GV-EcRF];Tg[UAS:N3ICDmyc] double transgenic (B) animals treated with tebufenozide from 8 hpf to 28 hpf, probed for nr2f2. Blue arrowheads show the position of the posterior cardinal vein. The inset numbers in panel B show the number of in situ-stained embryos exhibiting strongly reduced vascular expression over the total number of embryos examined. (C and D) Whole mount in situ hybridization of 24 hpf control (C) and kdrl:Su[H]DBM-2A-mCherry injected (D) animals, probed for nr2f2. Blue arrowheads show position of the posterior cardinal vein, red arrowheads show ectopic nr2f2 expression in the dorsal aorta. The inset numbers in panel D show the number of in situ-stained embryos exhibiting patches of strong ectopic nr2f2 expression in the dorsal aorta over the total number of embryos examined. (E–H) Whole mount in situ hybridization of 24 hpf control (E and G) and Tg[fli1a:GV-EcRF];Tg[UAS:N3ICDmyc] double transgenic (F and H) animals treated with tebufenozide from 8 hpf to 24 hpf, probed for sox7 (E and F) or sox18 (G,H). The inset numbers in panels F and H show the number of N3ICDmyc-expressing in situ-stained embryos exhibiting sox7 or sox18 expression comparable to that in controls, over the total number of embryos examined. Rostral is to the left and dorsal is up in all image panels. Scale bars, 100µm. |
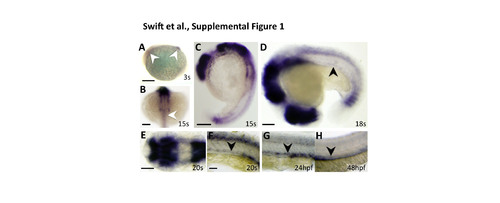
Early developmental expression of nr2f2 in the zebrafish. (A-G) Whole mount in situ hybridization images of developing 10.5 hpf whole lateral (A), 16.5 hpf anterior dorsal (B), 16.5 hpf whole lateral (C), 18 hpf whole lateral (D), 19 hpf head dorsal (E), 19 hpf trunk lateral (F), 24 hpf trunk lateral (G), and 48 hpf trunk lateral (H) views of zebrafish embryos probed for nr2f2. At 3s (A) and 15s (B,C) nr2f2 is expressed in the midbrain and cerebellum (white arrowhead in A) and the spinal cord (white arrowhead in B). This expression persists throughout development (E), but at 18s (D) expression is first identified in the developing axial vessels (black arrowhead). At 20s (F), 24 hpf (G), and 48 hpf (H) this vascular expression is confined to the PCV. The images in panels G and H are the same as those in Fig. 1B and H, respectively. Scale bars, (A,C) 200 µm, (B,DH) 100 µm. |
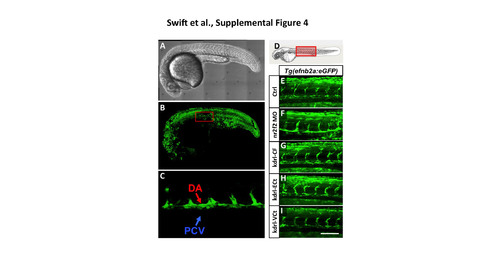
The Tg(efnb2a:eGFP) transgenic reporter is not responsive to nr2f2. (A) Transmitted light image of a 24 hpf Tg(efnb2a:eGFP) transgenic animal. (B) Green fluorescence confocal image of GFP expression in the animal in panel A, showing expression in muscle, neural, vascular, and other tissues. The red box shows approximate area magnified in panel C. (C) Higher magnification green fluorescence confocal image of GFP expression in the dorsal aorta (DA) but not in the posterior cardinal vein (PCV) in the animal in panel A. (D) Schematic diagram of a 1 dpf zebrafish (modified from (Kimmel et al., 1995)) with a red box showing the approximate position of images in BF. (E-I) Green fluorescent confocal micrographs of 24 hpf Tg(efnb2a:eGFP) transgenic zebrafish. Image planes above and below the dorsal aorta and intersegmental vessels were not used in the reconstructed confocal images shown here, to eliminate obscuring somitic expression of the transgene and permit visiualization of the vessels. Animals in image panels E-I were either untreated (E), injected with nr2f2 MO (F), injected with kdrl-CF (Full length nr2f2 under the control of the kdrl promoter; G), injected with kdrl- ECt (chimeric protein with nr2f2 lacking the transactivation domain fused to engrailed repressor domain; H), or injected with kdrl-VCt (chimeric protein with nr2f2 lacking the transactivation domain fused to VP16; I). Scale bar, 100 µm. |
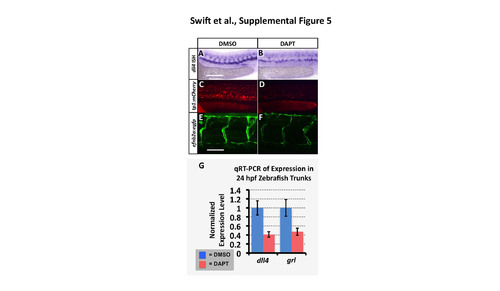
The Tp1:mCherry and efnb2a:eGFP transgenic reporters are responsive to reduced Notch signaling. (A,B) Whole mount in situ hybridization of 24 hpf zebrafish probed for dll4. (C,D) Red fluorescent confocal micrographs of 24 hpf Tg(Tp1bglob:hmgb1- mCherry)h11 (“tp1:mCherry”) transgenic zebrafish. (E,F) Green fluorescent confocal micrographs of 36 hpf Tg(efnb2a:egfp) transgenic zebrafish. Animals were either treated with control DMSO carrier (A,C,E) or with 100µm Notch inhibitor DAPT (B,D,F). Animals in DMSO/DAPT panel pairs were imaged using identical conditions for comparison. Superficial image planes were removed for visualization of vessels in the reconstructions shown in panels E and F because of extensive fluorescence in muscle and epidermis in this transgenic line. (G) Quantitative RT-PCR measurement of dll4 and grl gene expression in excised trunks (see Materials and Methods) of 24 hpf animals. Values are all normalized to control gene expression levels, which are set equal to 1. Rostral is to the left and dorsal is up in all image panels. Scale bars, (A-D) 200 µm, (E,F) 50 µm. |
Reprinted from Developmental Biology, 390, Swift, M.R., Pham, V.N., Castranova, D., Bell, K., Poole, R.J., Weinstein, B.M., SoxF factors and Notch regulate nr2f2 gene expression during venous differentiation in zebrafish, 116-25, Copyright (2014) with permission from Elsevier. Full text @ Dev. Biol.