
- Title
-
An evolutionarily conserved long noncoding RNA TUNA controls pluripotency and neural lineage commitment
- Authors
- Lin, N., Chang, K.Y., Li, Z., Gates, K., Rana, Z.A., Dang, J., Zhang, D., Han, T., Yang, C.S., Cunningham, T.J., Head, S.R., Duester, G., Dong, P.D., and Rana, T.M.
- Source
- Full text @ Mol. Cell

Identification of lincRNAs Involved in the Maintenance of mESC Self-Renewal and Pluripotency (A) Knockdown of lincRNA transcription in CCE mESCs 4 days after infection. Transcript levels were measured by qRT-PCR and normalized to Actb mRNA levels. Data are the mean ± SD of triplicates. (B) Fluorescence (upper panels) and bright-field (lower panels) micrographs of Oct4-ESCs after infection with a nontargeting control shRNA or shRNAs targeting Oct4 and six lincRNAs. Scale bars, 100 mm. (C and D) Relative expression of Nanog (C) and Oct4 (D) mRNA after knockdown of 20 selected lincRNAs, each with 2 shRNAs (hairpin 1 and hairpin 2). Expression levels were normalized to Actb. Data are the mean ± SD of triplicates. See also Figure S2 and Table S3. |

A Highly Conserved lincRNA, linc86023, Is Required for the Maintenance of mESC Pluripotency (A) Schematic of the mouse linc86023 locus on chromosome 12 (UCSC genome version NCBI37/mm9). BC059025 (3,281 bp) and AK045952 (2,876 bp) are alternatively transcribed forms. Blue rectangles represent flanking exons, and blue arrowheads indicate the direction of transcription. Middle panels show ChIP-seq signals of active histone marks H3K4me3 (red) and H3K36me3 (green) in E14 and Bruce4 mESC lines (data from ENCODE/LICR Histone). The bottom profile shows the level of linc86023 sequence conservation in vertebrates. (B) Northern blot of RNA from CCE mESCs, indicating the linc86023 transcript size (<3000 nt). (C) RNA FISH for linc86023 in CCE cells. (D) Linc86023 was found in both nuclear and cytoplasmic fractions. Cellular fractionation was performed in CCE cells followed by RNA isolation, and mRNA levels of XIST, GAPDH, and linc86023 were measured by qRT-PCR. The relative subcellular fraction of each gene was shown. (E) Alkaline phosphatase staining of CCE mESCs on day 4 following transduction with a control shRNA or 3 independent shRNAs targeting linc86023. Scale bars, 50 µm. (F) Decreased expression of linc86023 and seven pluripotency genes after knockdown of linc86023 by three shRNAs. qRT-PCR was performed 4 days after transduction. Gene expression was normalized to Actb mRNA levels. Data are the mean ± SD of triplicates. (G and H) CCE mESC cell proliferation after knockdown (G) and overexpression (H) of linc86023. Cell proliferation (measured as the absorbance at 490 nm) was measured 4 days after shRNA treatment (G) or 5 days after transfection with pcDNA3-linc86023 (H). See also Fig. S3. |
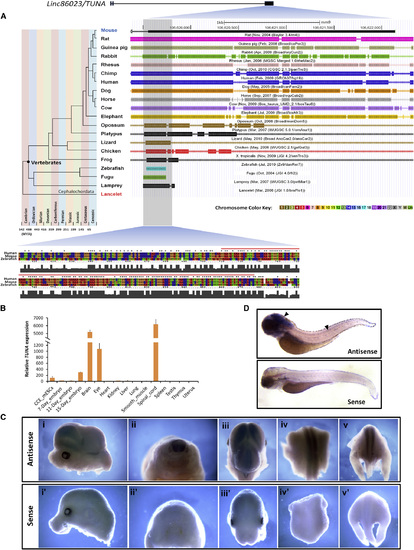
linc86023 TUNA Is Evolutionarily Conserved and Expressed Specifically in the CNS (A) Comparative genomic alignment of 19 species to the mouse genome (mm9) at the 52 end of the largest exon of linc86023/TUNA. Chromosome numbers are indicated by the color key. Bottom panel shows alignment of the human, mouse, and zebrafish sequence around the highly conserved region (<200 bp, red line). (B) Expression of TUNA in 15 mouse tissues was measured by qRT-PCR and normalized to Actb mRNA levels. (C) In situ hybridization of TUNA RNA in E13.5 mouse embryos. Panels show side view of the head (i and i2), transverse plane of the body (ii and ii2), overhead view (iii and iii2), dorsal view of the middle body (iv and iv2), and dorsal view of the lower body (v and v2). Upper panels show the embryo hybridized with the antisense probe, while lower panels show that with the sense probe. (D) Whole mount in situ hybridization of tuna in zebrafish embryo (72 hr postfertilization) showing tuna expression in the brain and spinal cord (arrowhead). The lower panel shows the embryo hybridized with the sense probe. See also Fig. S4. EXPRESSION / LABELING:
|

lincRNA TUNA Is Required for Neuronal Differentiation of mESCs (A) qRT-PCR analysis of TUNA, Nestin, and Oct4 expression during neuronal differentiation of CCE mESCs. Total RNA was extracted on the indicated days of monolayer neural differentiation cultures, and relative mRNA levels were normalized to 18S rRNA. Data are the mean ± SD of triplicates. (B) qRT-PCR analysis of neuronal lineage genes in CCE mESCs following shRNA-mediated silencing of TUNA. RNA was extracted 4 days after transduction, and mRNA levels were normalized to Actb. (C) Heatmap showing hierarchical clustering of differentially expressed genes following TUNA knockdown. Shown are genes with a difference e3-fold in expression in TUNA-depleted versus control CCE mESCs. RNA was extracted on days 0, 2, 4, and 6 of neural differentiation culture. (D) Enriched gene ontology (GO) processes of the ten gene clusters identified in (C). (E and F) Fluorescence and bright-field micrographs of in vitro differentiated CCE mESCs transduced with control or TUNA-specific shRNA. CCE cells were transduced after 2 days of differentiation and analyzed at day 7. Upper panels show cells immunostained for Nestin (E) and Tuj1 (F). Middle panels show Hoechst nuclear staining, and lower panels show bright-field images. Scale bars, 100 µm. (G) Brain histone H3K4me3 ChIP-seq analysis (UMMS Brain Histone [Akbarian/Weng] UCSC track, GRCh37/hg19) of the human TUNA ortholog (LINC00617) in neuronal and nonneuronal nuclei collected from the prefrontal cortex of a 4.7-year-old male and a 69-year-old female. (H) Knockdown of human TUNA (LINC00617) abolished neural differentiation in human. The monolayer culture method was performed in H9 hESCs. Lentiviral infection was performed on day 3 upon neural induction. Neural progenitor cells were immunostained for Pax6 at day 8. Scale bars, 50µm. See also Fig. S5 and Table S4. |
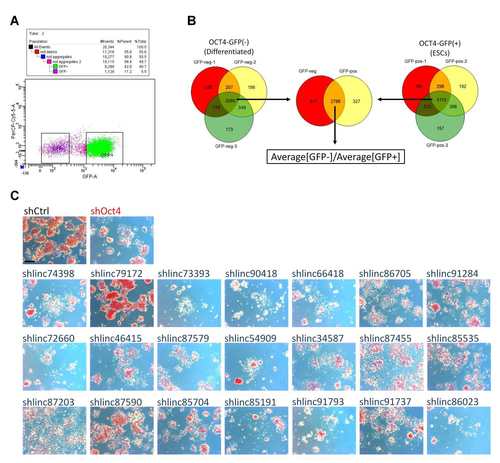
Identification and characterization of lincRNAs involved in mESC self-renewal. (A) Oct4-GFP mESCs were transduced with the shRNA library and selected for 4 days in ESC medium. The GFP+ (undifferentiated) and GFP- (differentiated) cells were isolated by FACS and DNA was extracted. (B) The scheme to identify the candidate lincRNAs essential for self-renewal. A total of 3265 shRNAs were represented in the three GFP- biological replicates and 3115 in the GFP+ replicates. For each shRNA in the common set of 2788, the ratio of {Average[GFP-]/Average[GFP+]} was calculated. The ratio for the nontargeting control shRNA was 1.29. Candidate lincRNA genes were selected if at least two shRNAs were present at a GFP-/GFP+ ratio >2.5 or if one shRNA was present at a ratio >3. (C) AP staining of mESCs on day 4 after knockdown of 21 selected lincRNA genes. Control cells were transduced with a nontargeting shRNA (shCtrl) or an Oct4-specific shRNA. Two shRNAs were tested for each lincRNA. Scale bars, 100 µm. |
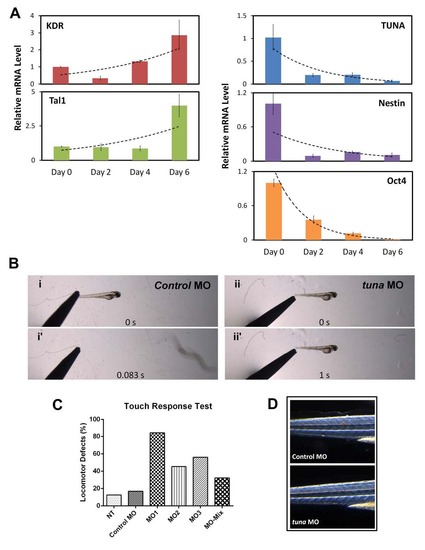
Specific induction of TUNA during neural differentiation of mESCs. (A) Gene expression during in vitro ESC differentiation towards the mesodermal lineage. mESC cells and RNA were harvested on the indicated days. Expression of KDR, Tal1 (mesoderm lineage markers), TUNA, Nestin, and Oct4 were measured by qRT-PCR. Transcript levels were normalized to Actb and compared with expression on day 0. Data are the mean ± SD of triplicates. (B) Behavioral response of zebrafish larvae to a touch stimulus. Embryos were microinjected with 1 ng of a mixture of tuna MOs or a control MO, and a touch response test was performed at 3 dpf. Images are single frames from a movie showing the locomotory response of zebrafish injected with tuna MOs (ii and ii2), compared with animals injected with the control MO (i and i2). (C) Quantification of zebrafish larvae showing impaired locomotor function. Embryos were microinjected with 1ng of three individual tuna MOs, mixed MOs, or a control MO. Touch response test was performed at 3 dpf. The percentage of embryos demonstrating behavioral defects is shown (n H 50). (D) Animals showed no apparent skeletal muscle defects upon tuna MO treatment, indicating that the behavioral phenotype is a reflection of tuna MO effects on the CNS. PHENOTYPE:
|
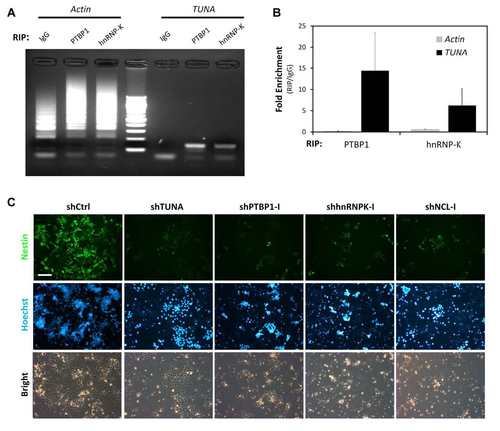
Functional analysis of TUNA-associated RBPs. (A) Verification of RNA-protein interaction by RIP. CCE mESCs were crosslinked with 1% formaldehyde and incubated with anti-hnRNP-K or anti-PTBP1. IgG was used as a negative control. After pulldown, RNA was extracted and RT-PCR analysis of TUNA or Actb was performed on equal concentrations of RNA. PCR products were analyzed by agarose gel electrophoresis. The correct size of the PCR amplicons is ~150 bp. (B) Enrichment of TUNA or Actb in RIPs performed with anti-PTBP1 or anti-hnRNP-K compared with control IgG immunoprecipitates. Data are the mean ± SD of triplicates. (C) In vitro neural differentiation is impaired by depletion of TUNA-associated RBPs. CCE mESCs were differentiated in monolayer cultures for two days and then transduced with shRNAs targeting TUNA, PTBP1, hnRNP-K, or NCL. Cells were analyzed at five days post-transduction. Top and middle rows show fluorescence micrographs of Nestin and Hoechst nuclear staining, respectively. Bottom row shows the bright-field images. Scale bars, 200 µm. |