
|
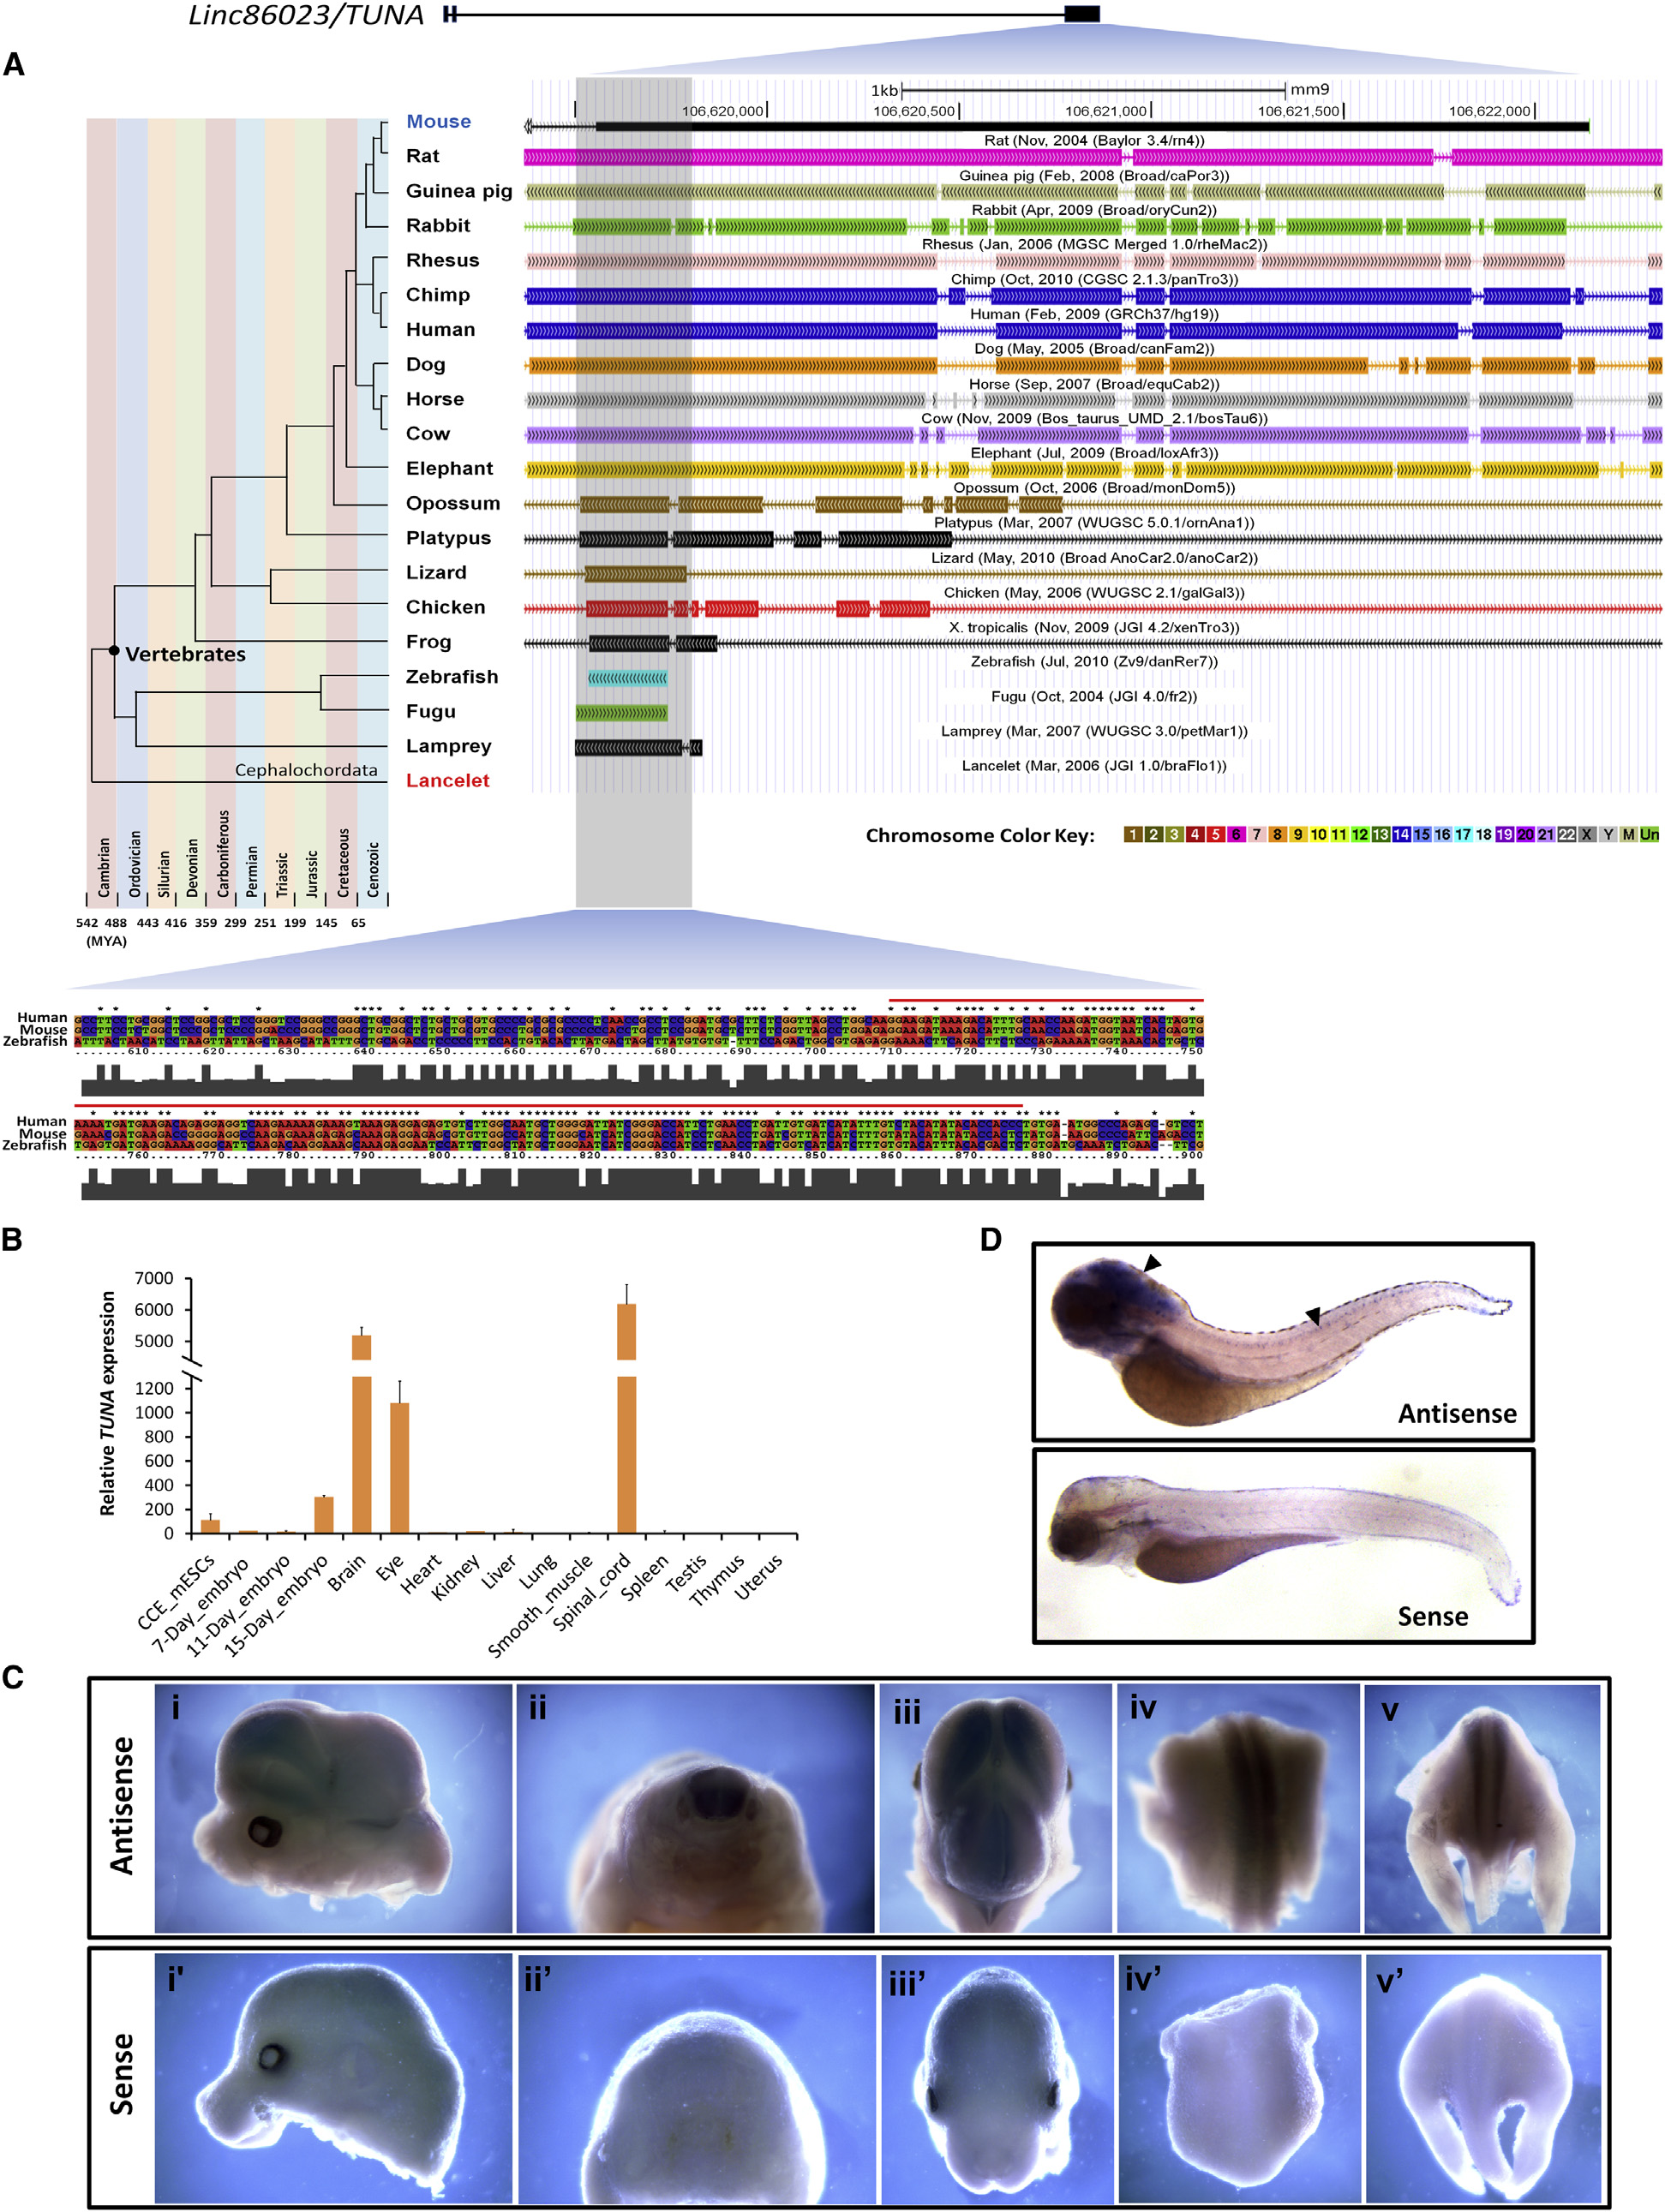
Fig. 4 linc86023 TUNA Is Evolutionarily Conserved and Expressed Specifically in the CNS
(A) Comparative genomic alignment of 19 species to the mouse genome (mm9) at the 52 end of the largest exon of linc86023/TUNA. Chromosome numbers are indicated by the color key. Bottom panel shows alignment of the human, mouse, and zebrafish sequence around the highly conserved region (<200 bp, red line).
(B) Expression of TUNA in 15 mouse tissues was measured by qRT-PCR and normalized to Actb mRNA levels.
(C) In situ hybridization of TUNA RNA in E13.5 mouse embryos. Panels show side view of the head (i and i2), transverse plane of the body (ii and ii2), overhead view (iii and iii2), dorsal view of the middle body (iv and iv2), and dorsal view of the lower body (v and v2). Upper panels show the embryo hybridized with the antisense probe, while lower panels show that with the sense probe.
(D) Whole mount in situ hybridization of tuna in zebrafish embryo (72 hr postfertilization) showing tuna expression in the brain and spinal cord (arrowhead). The lower panel shows the embryo hybridized with the sense probe. See also Fig. S4.