
- Title
-
3-OST-7 regulates BMP-dependent cardiac contraction
- Authors
- Samson, S.C., Ferrer, T., Jou, C.J., Sachse, F.B., Shankaran, S.S., Shaw, R.M., Chi, N.C., Tristani-Firouzi, M., and Yost, H.J.
- Source
- Full text @ PLoS Biol.
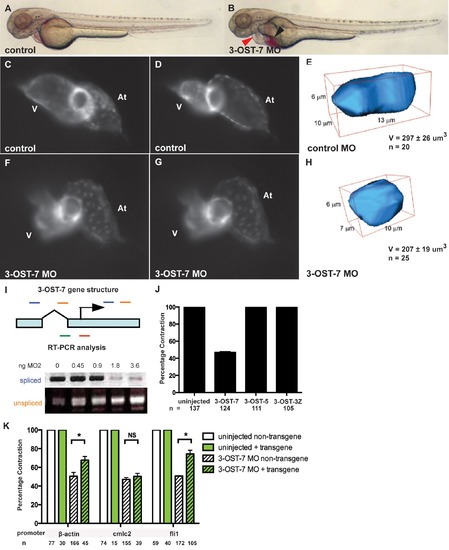
3-OST-7 is required for ventricular contraction in the zebrafish heart. Lateral views of control (uninjected, wild-type) (A) and 3-OST-7 morphant (B) embryos at 48 hpf showing edema (red arrowhead) and blood pooling (black arrowhead) with knockdown of 3-OST-7. Lateral views of hearts in control (C–D) and 3-OST-7 morphant (F–G) Tg(cmlc2:gfp) embryos at periods of ventricular diastole (C and F) and systole (D and G). 3D-reconstructed ventricular cell in control (E) and 3-OST-7 morphant (H) embryos show decreased volume (V) in morphants. (I) Gene structure of 3-OST-7 showing MO targets (red for MO1 and green for MO2) and primer sets used for RT-PCR analysis (blue and orange bars). RT-PCR analysis showing decrease in spliced and increase in unspliced products with increasing dose of MO injected. (J) Percentage contraction of embryos in different 3-OST knockdowns (3-OST-7, 3-OST-5, 3-OST-3Z). Only knockdown of 3-OST-7 MO resulted in ventricular noncontraction. (K) Percentage contraction of embryos in rescue experiments using three different transgenes. Uninjected embryos with (green bar) or without (white bar) the transgene had normal ventricular contraction. Injection of 3-OST-7 MO2 in Tg(β-actin:3-OST-7-IEP) and Tg(fli1:3-OST-7-IEP) embryos rescued the noncontracting ventricle phenotype (p = 0.039 and p = 0.0036, respectively, *). Injection of 3-OST-7 MO2 in Tg(cmlc2:3-OST-7-IEP) did not rescue the phenotype (p = 0.44, NS). Graphs depict the percentage of embryos with phenotype in 3-OST-7-overexpressing (GFP+, green hatched) or non-3-OST-7-overexpressing (GFP-, white hatched) embryos from individual crosses between one of three transgenic founders and wild-type AB zebrafish. At, atrium; V, ventricle; error bars, SEM. |
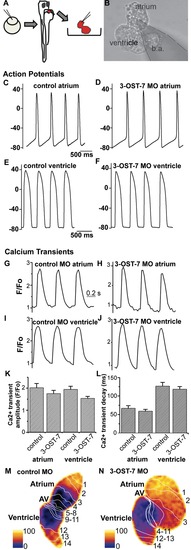
Noncontracting ventricle in 3-OST-7 morphants generates normal action potentials and calcium transients. (A) Zebrafish embryos were injected with 3-OST-7 MO1 at one-cell stage and allowed to develop until 48 hpf. The heart was then dissected out of the embryo and either placed in a recording chamber perfused with external control solution (for action potential analysis) or incubated in Fluo-4 and imaged using a confocal microscope (for calcium transient analysis). Control 48 hpf hearts from uninjected embryos or injected with control 3-OST-5 MO were processed in parallel. (B) A suction pipette was used to patch clamp the heart at the atrial or ventricular region. Action potentials were recorded from atria (C–D) and ventricles (E–F) of control (uninjected, WT) (C and E) and 3-OST-7 morphant (D and F) embryos. The action potentials were comparable between control and 3-OST-7 morphant embryos. Regions were selected from atrium and ventricle to record the calcium transients (G–J) and measure the Ca2+ transient amplitude (K) and Ca2+ transient decay (L) (error bars, SEM). No significant difference was detected between control and 3-OST-7 morphant embryos (p = 0.30 for atrial transient amplitude; p = 0.16 for ventricular transient amplitude; p = 0.37 for atrial transient decay; and p = 0.51 for ventricular transient decay). In the second technique to image the calcium transients, 3-OST-7 MO1 or control 3-OST-3Z MO was injected into Tg(cmlc2:gCaMP)s878 embryos at one-cell stage and allowed to develop until 48 hpf. Optical maps of calcium activation for a single cycle, represented by isochronal lines every 20 ms, show calcium activation and conduction velocity proceed normally in 3-OST-7 morphants (N) compared to control MO injected embryos (M). Conduction proceeds from the atrium through the AV canal to the ventricle and numbers indicate the temporal sequence of calcium activation. Color bar chart fluorescence intensity changes on a scale of 0 to 100. b.a., bulbus arteriosus. PHENOTYPE:
|
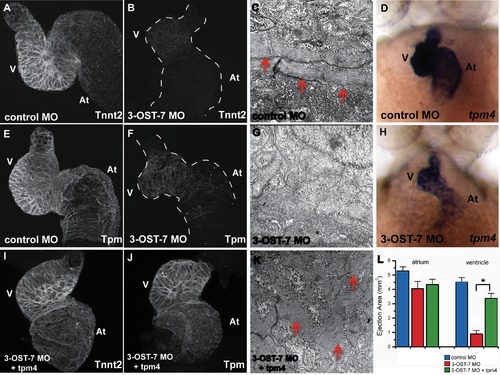
3-OST-7 regulates tpm4-driven myofibrillogenesis, sarcomere assembly and ventricular contraction. Whole mount IHC was performed on fixed 48(injected with control 3-OST-3Z MO) or 3-OST-7 morphant embryos to detect cardiac sarcomere proteins (n = 30 for each group). The heart was then dissected out of the embryo, mounted on cover slips, and imaged using a confocal microscope (thus, the dorso-ventral orientation of the mounted hearts was random). IHC using anti-Tnnt2 antibody and anti-Tpm antibody revealed levels of these proteins were greatly reduced in 3-OST-7 morphants (B and F, dashed lines outline the hearts) compared to control (A and E) embryos. TEM of control (C) and 3-OST-7 morphant (G) hearts show the presence of organized myofibrils (red arrowheads) in control and absence in morphants. ISH for tpm4 showed tpm4 transcript levels were decreased in 3-OST-7 morphants (H) compared to control embryos (D) at 48 hpf. (D and H) are ventral views with anterior on top; n = 40 for each group. Overexpression of tpm4 rescues the expression of Tnnt2 (I) and Tpm (J) proteins, assembly of myofibrils (K), and the noncontracting ventricle phenotype in 3-OST-7 morphant embryos as assessed by ejection area measurements (L, p<0.05, *). The ejection area, a measure of contractility, was obtained by computing the difference between systolic and diastolic area for either atrium or ventricle. At, atrium; V, ventricle; error bars, SEM. |
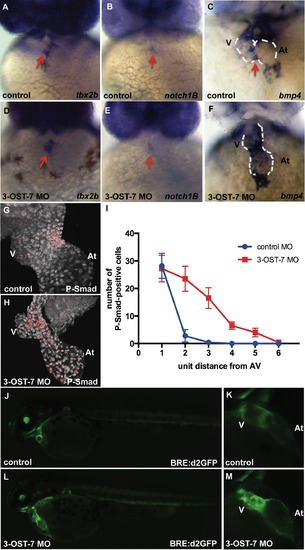
3-OST-7 controls region-specific BMP signaling in differentiating heart. ISH for tbx2b (A and D), notch1B (B and E) showed normal AV-restricted expression, whereas bmp4 expression (C and F) showed ectopic expression in ventricular myocardium of 3-OST-7 morphants at 48 hpf (n = 30 for each group). IHC for P-Smad at 48 hpf showed delocalized expression in nuclei of 3-OST-7 morphant ventricle (H) compared to localized AV canal expression in control (G) (n = 10 for each group). (I) Graph depicting increased P-Smad-positive nuclei in the ventricle several unit distances away from the AV in 3-OST-7 morphants compared to P-Smad-positive nuclei localized in the AV for control (error bars, standard deviation). Imaging of live Tg(BRE:d2GFP) fish (J and L) showed GFP expression localized to the AV junction in control (K) and expanded expression in ventricle in morphant (M). V, ventricle; At, atrium; red arrows point to AV; white dashed lines outline the hearts. EXPRESSION / LABELING:
|
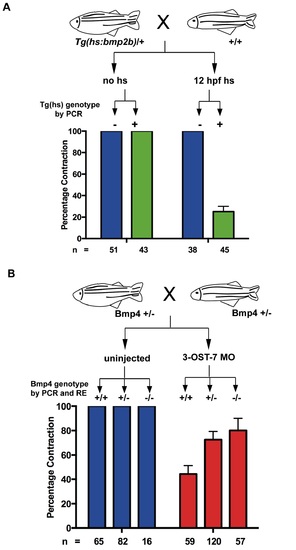
3-OST-7 regulates cardiac contraction by constraining BMP signaling. (A) Tg(hs:bmp2b) heterozygotes were crossed to wild-type zebrafish and embryos were either untreated (no hs) or heat-shocked at 12 hpf. Embryos in each group were scored for ventricular contraction, and then genotyped for presence of heat-shock transgene. Graph depicts percentage contraction of embryos with transgene (green) or without (blue) in each treatment group. Induction of BMP signaling led to ventricular noncontraction. (B) bmp4st72 heterozygotes were crossed and embryos were either uninjected or injected with 3-OST-7 MO. Embryos in each group were scored for ventricular noncontraction, and then genotyped for bmp4 mutation (RE, digestion with SpeI). Graph depicts percentage contraction of each genotypic class in uninjected embryos (blue) or embryos injected with 3-OST-7 MO (red). Ventricular noncontraction was rescued in 3-OST-7 morphants by bmp4st72 mutation. PHENOTYPE:
|
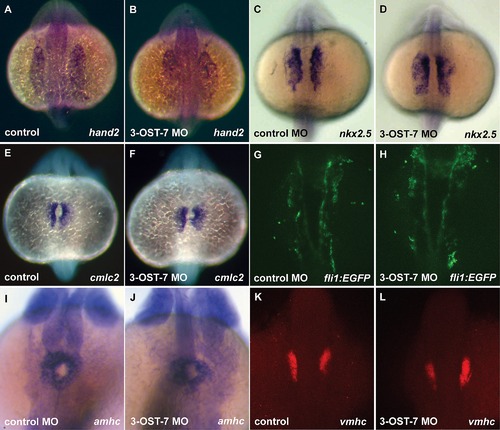
Heart field specification proceeds normally in 3-OST-7 morphants. Dorsal views (anterior on top) of control (uninjected, wild-type) (A, C, E, and K), control MO (injected with control 3-OST-3Z MO) (G and I), and 3-OST-7 morphant (B, D, F, H, J and L) embryos; n = 35 for each group. ISHs for: lateral plate mesoderm marker hand2 (A and B, 17 hpf) and cardiac precursor cell marker nkx2.5 (C and D, 17 hpf), myocardial precursor cell marker cmlc2 (E and F, 17 hpf), atrial precursor cell marker amhc (I and J, 20 hpf), and ventricular precursor cell marker vmhc (K and L, 18 hpf) showed comparable levels and patterns of expression in control and 3-OST-7 morphant embryos. Imaging of fli1 expression in Tg(fli1:EGFP) zebrafish at 18 hpf revealed endocardial lineage is intact in 3-OST-7 morphant embryos (G and H). |
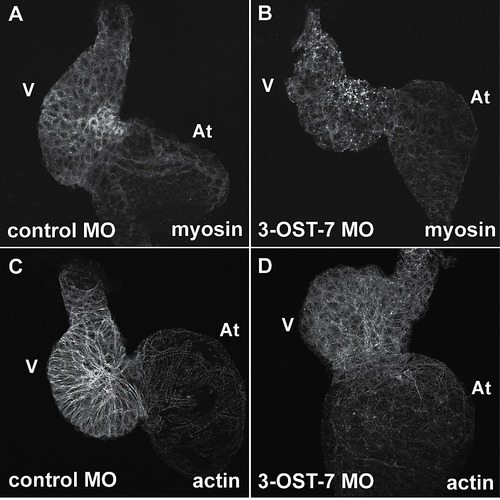
Knockdown of 3-OST-7 disrupts sarcomere organization. Whole mount IHC using anti-myosin (MF20) and phalloidin revealed myosin and actin filaments were disorganized in ventricles of 3-OST-7 morphants (B and D) compared with control (A and C) (n = 30 for each group). At, atrium; V, ventricle. |
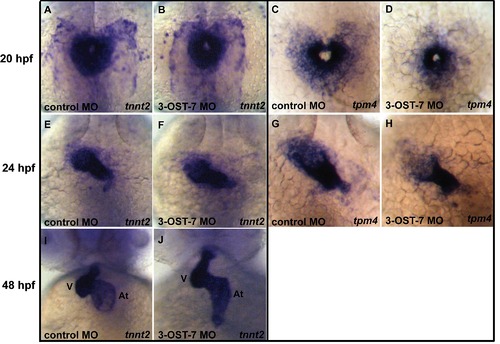
3-OST-7 controls transcript levels of tpm4 but not those of tnnt2. In situ analysis for tnnt2 showed comparable transcript levels and patterns of expression for 3-OST-7 morphants (B, F, and J) and control (injected with control 3-OST-3Z MO) embryos (A, E, and I) at 20 hpf (A and B), 24 hpf (E and F), and 48 hpf (I and J). In contrast, tpm4 transcripts were decreased in 3-OST-7 morphants (D and H) compared to control embryos (C and G) at 20 hpf (C and D) and 24 hpf (G and H). (A–D) are dorsal views with anterior on top; (E–J) are ventral views with anterior on top; n = 40 for each group. At, atrium; V, ventricle. |
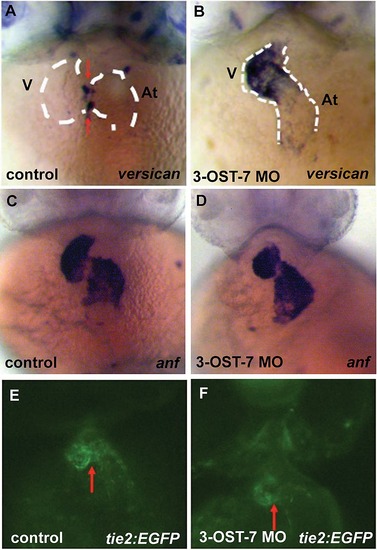
Knockdown of 3-OST-7 affects expression pattern of versican but does not alter expression patterns of other heart differentiation markers at 48 hpf. ISH for versican, an AV myocardium-localized marker, showed ectopic expression in ventricular myocardium of 3-OST-7 morphants (A and B). Expression of anf, a marker for chamber myocardium, was comparable between control and 3-OST-7 morphants (C and D). Tie2 expression, assessed in Tg(tie2:EGFP) embryos, was normally expressed in 3-OST-7 morphant AV endocardium (F) and is similar to control (E). Control groups (A and C) were injected with control 3-OST-3Z MO, control (E) was uninjected. V, ventricle; At, atrium; red arrows point to AV; dashed white lines outline the heart. |
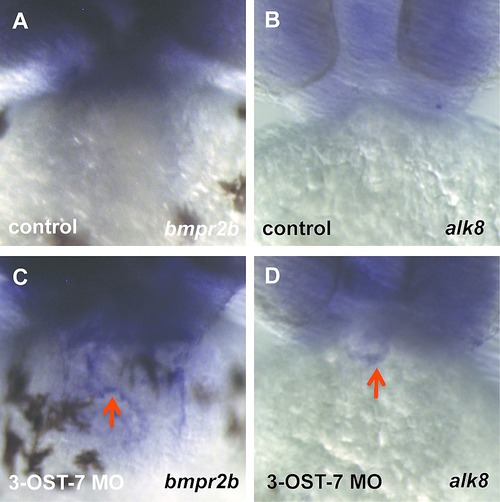
Knockdown of 3-OST-7 alters expression patterns of BMP receptors bmpr2b and alk8. ISH for bmpr2b (A, C) showed ectopic expression in heart (C, red arrow) of 3-OST-7 morphant. ISH for alk8 (B, D) showed ectopic expression in outflow tract (D, red arrow) of 3-OST-7 morphant. |