
- Title
-
Transforming growth factor beta signalling controls human breast cancer metastasis in a zebrafish xenograft model
- Authors
- Drabsch, Y., He, S., Zhang, L., Snaar-Jagalska, B.E., and Ten Dijke, P.
- Source
- Full text @ Breast Cancer Res.
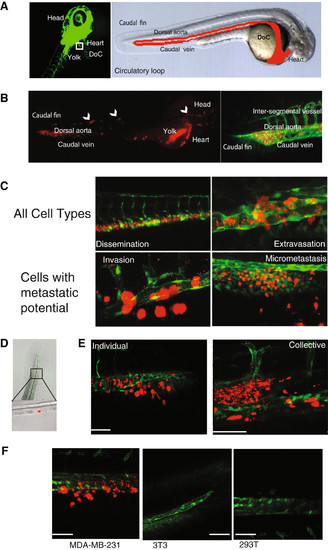
Schematic of embryonic zebrafish and injections into the ducts of Cuvier. (A) Fluorescent microscopy image of a 48 h-post fertilization (hpf) Tg(fli1:GFP) zebrafish. The boxed area represents the ideal injection site. The cells will then enter into the circulatory loop, as shown in the light microscopy image. The dorsal aorta, caudal vein, and ducts of Cuvier (DoC) are emphasized with red. (B) mCherry-labelled MDA-MB-231 cells injected into the DoC immediately disseminate throughout the vasculature. Image was taken 2 h-post implantation (hpi). A magnification of the tail region, displaying the vasculature (green), and cells (red) is shown. (C) Typical images of the various stages of cell survival in the zebrafish embryo. Only cells with metastatic potential are capable of undergoing invasion and micrometastasis. MDA-MB-231 cells (red) are shown. (D) A light microscopy image of the tail fin after injection with fluorescent polystyrene beads. Beads become lodged within the end of the circulatory loop. (E) MDA-MB-231 cells (red) displayed invasion as singular cells into the collagen fibres of the tail fin (scale bar = 100 μm). M2 and M4 (shown) displayed an invasive phenotype in with cells collectively cluster together (scale bar = 50 μm). (F) Only tumourigenic cells were capable of displaying invasive properties in the fish. MDA-MB-231 cells were compared to the motile, but non-invasive 3 T3 cells, and the weakly tumorigenic 293 T cells. Scale bar = 100 μm. Data are representative of three independent experiments with at least 50 embryos per group. |
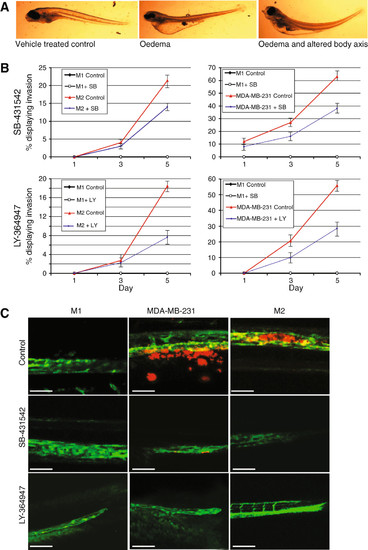
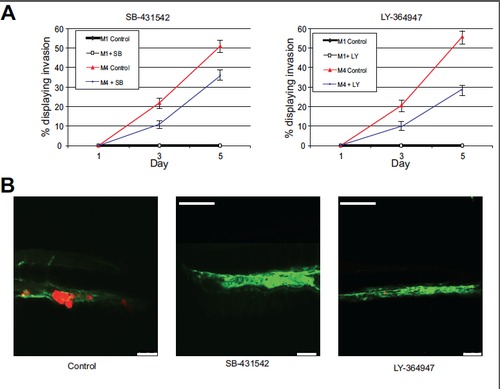
Small molecular TGF-β receptor kinase inhibitor (TKRI) inhibited invasion of human breast cancer cells. (A) Typical deformities seen with higher doses of SB-431542 and LY-364947. (B) Graphical representation of the percentage of embryonic zebrafish with invading breast cancer cells. Each group contained the non-invasive M1 cells as a control. The TKRIs were added directly to the fish water every second day. MDA-MB-231 and M2 cells are shown. Errors bars represent standard deviation. (C) Representative images taken at 5 days post injection. MDA-MB-231 cells have left the vasculature and are located within the collagen fibres of the tail fin. M2 cells have moved out of the vasculature and into the caudal haematopoietic tissue. All data are representative of three independent experiments with at least 50 embryos per group. Scale bar = 50 μm. |
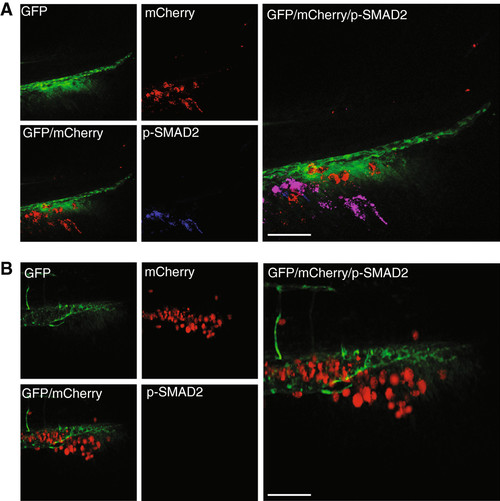
Small molecular TGF-β type 1 receptor (TKRI) reduce expression of phosphoylated (p)Smad2. pSmad2 expression of MDA-MB-231 cells that were not treated for 5 days post implantation (dpi), and then were treated for 1 h with (A) vehicle or (B) SB-431542. The SB-431542-treated cells were negative for TKRI activation. Data are representative of three independent experiments with at least 50 embryos per group. Scale bar = 100 μm. |
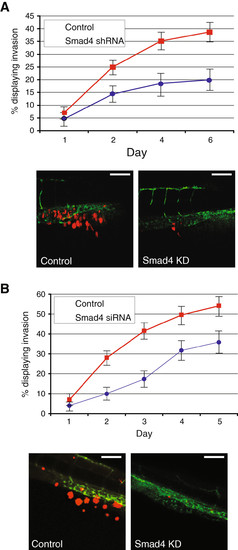
Smad4 knockdown by shRNA or siRNA in breast cancer cells. (A) MDA-MB-231 with stable knockdown of Smad4 displays a reduced amount of invasion. A representative image from day 6, showing cells located in the collagen fibres of the tail is shown. (B) Transient knockdown of Smad4 in MDA-MB-231 cells was also capable of inhibiting the amount of invasion over 5 days. A representative image from day 5 is shown. Scale bar = 100 μm. Data are representative of three independent experiments with at least 50 embryos per group. Error bars represent standard deviation. |
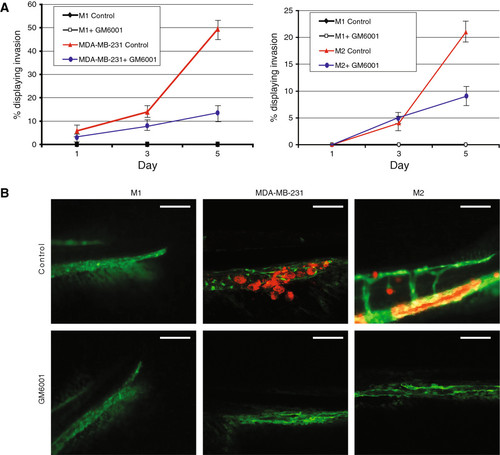
Small molecular inhibition of matrix metalloproteinases (MMPs). (A) Graphical representation of M2 and MDA-MB-231 cells treated with the MMP inhibitor GM6001 over 5 days. Inhibition of MMP expression reduces the amount of invasion of breast cancer cells. (B) Representative images of MDA-MB-231 cells that have migrated to the collagen fibres or M2 cells that have located to the caudal hematopoietic tissue. Scale bar = 100 μm. Data are representative of three independent experiments with at least 50 embryos per group. Errors bars represent standard deviation. |
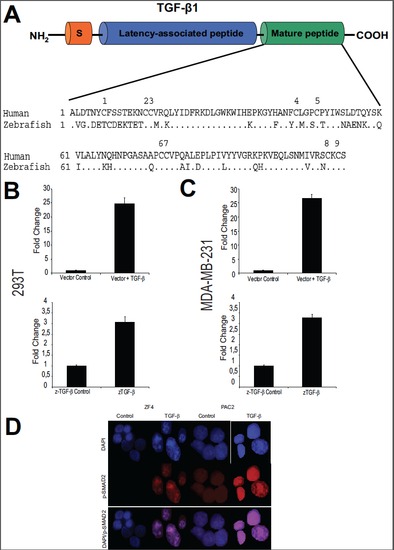
z-Transforming growth factor-β (TGF-β) is highly homologous to higher vertebrates. (A) A sequence analysis of the mature peptide from the human and zebrafish is compared. (B) Zebrafish (z)-TGF-βR transfected into 293 T cells was capable of inducing transcription, as indicated by the CAGA luciferase assay. (C) A similar result was also seen with MDA-MB-231 cells; P = 0.05. (D) Human TGF-β 1 was capable of activating the TGF-β signalling pathway in the zebrafish cell lines ZF4 and PAC2. Errors bars represent standard deviation. |
(A) Graphical representation of the percentage of embryonic zebrafish with invading M4 breast cancer cells. The non-invasive M1 cells were used as a control. Error bars represent standard deviation. (B) Representative images taken at 5 days post injection. Scale bar = 50 μm. |
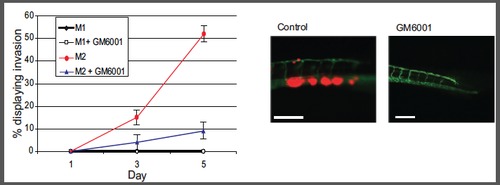
Small molecular inhibition of matrix metalloproteinase (MMP) with GM6001. Graphical representation of M4 cells treated with the general MMP inhibitor over 5 days. Inhibition of MMP expression reduces the amount of invasion of breast cancer cells. A representative image is included. Scale bar = 100 μm. Error bars represent standard deviation. |