
|
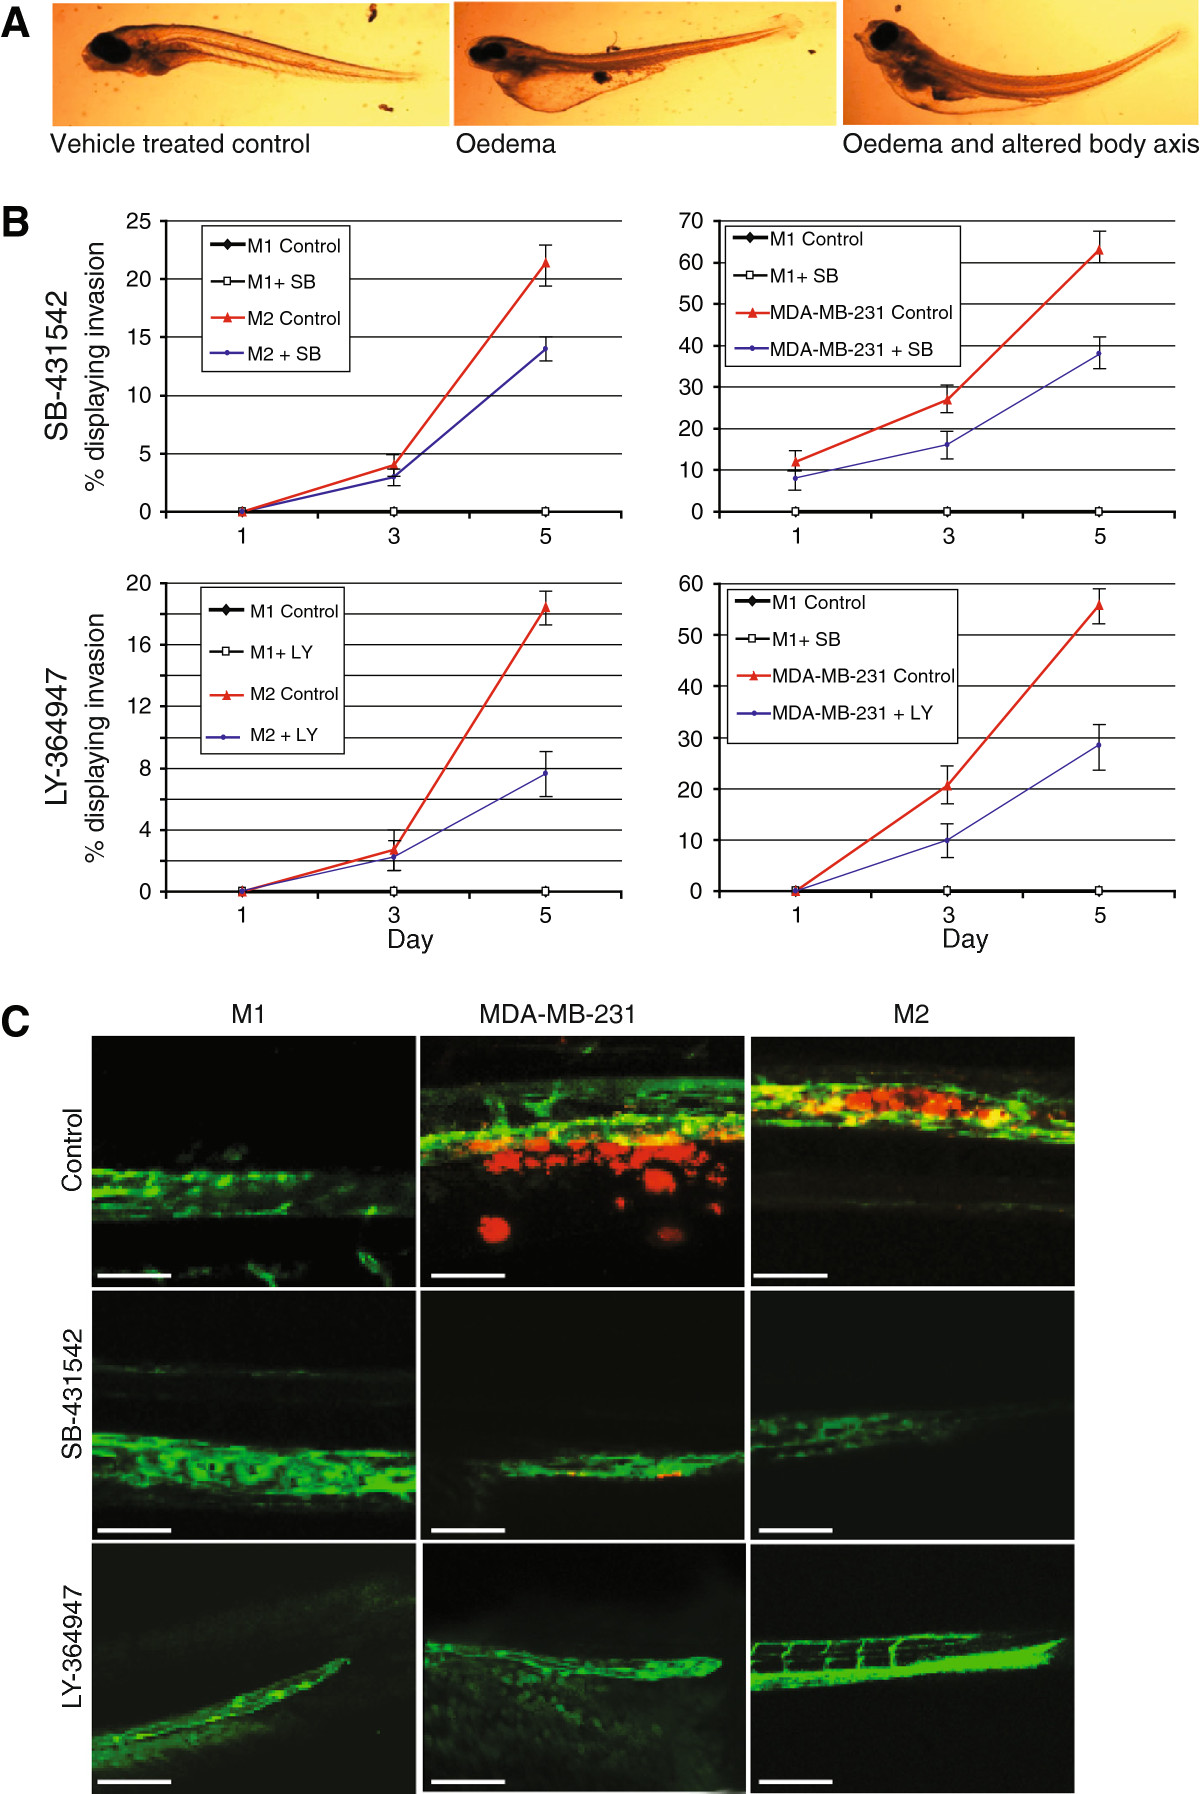
Fig. 2
Small molecular TGF-β receptor kinase inhibitor (TKRI) inhibited invasion of human breast cancer cells. (A) Typical deformities seen with higher doses of SB-431542 and LY-364947. (B) Graphical representation of the percentage of embryonic zebrafish with invading breast cancer cells. Each group contained the non-invasive M1 cells as a control. The TKRIs were added directly to the fish water every second day. MDA-MB-231 and M2 cells are shown. Errors bars represent standard deviation. (C) Representative images taken at 5 days post injection. MDA-MB-231 cells have left the vasculature and are located within the collagen fibres of the tail fin. M2 cells have moved out of the vasculature and into the caudal haematopoietic tissue. All data are representative of three independent experiments with at least 50 embryos per group. Scale bar = 50 μm.