
Image
|
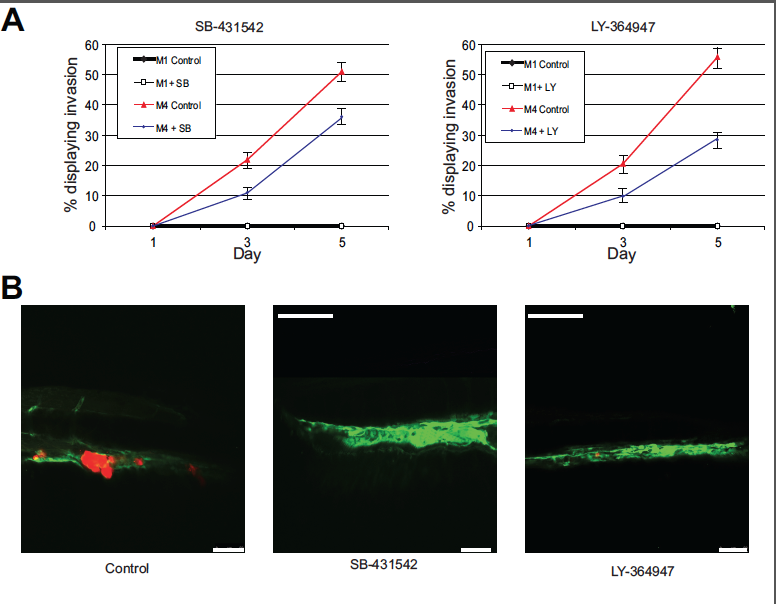
Figure Caption
Fig. S2
(A) Graphical representation of the percentage of embryonic zebrafish with invading M4 breast cancer cells. The non-invasive M1 cells were used as a control. Error bars represent standard deviation. (B) Representative images taken at 5 days post injection. Scale bar = 50 μm.
Acknowledgments
This image is the copyrighted work of the attributed author or publisher, and
ZFIN has permission only to display this image to its users.
Additional permissions should be obtained from the applicable author or publisher of the image.
Full text @ Breast Cancer Res.